INDUSTRY ANALYTICS FOR THE CITY OF PHILADELPHIA'S WORKFORCE STRATEGY
Crafting policy that strikes an effective balance between supporting economic growth and expanding equity of opportunity is critical for moving Philadelphia forward. It requires an understanding not only of where the economy is growing, but where growth supports family-sustaining jobs that provide long-term career pathways.
To this end, as the City of Philadelphia embarked on the development of its citywide workforce strategy “Fueling Philadelphia’s Talent Engine,” it turned to the Economy League for targeted research and data analysis to inform decision-making. The Economy League analyzed labor market data for seven target industry sectors in the city and metro area to assess scale, historical and projected job growth, wages, and education and skill requirements across sectors. Our analysis, summarized below, provides detailed insight into local sector dynamics and workforce opportunities that helped shape the goals and recommendations included in “Fueling Philadelphia’s Talent Engine.”
KEY OBSERVATIONS & INSIGHTS
Review of labor data suggests that over the past decade, middle-skill employment has not seen the same gains as low-skill and high-skill employment in Philadelphia—but there is variation between sectors.
At a macro level, reports on the trajectory of middle-skill employment opportunities have demonstrated cause for concern. Studies have shown a long-term decline since the 1970s in the number and share of middle-skill jobs across the United States as technological advancement and globalization have contributed to the general polarization of the workforce around low-skill and high-skill jobs.
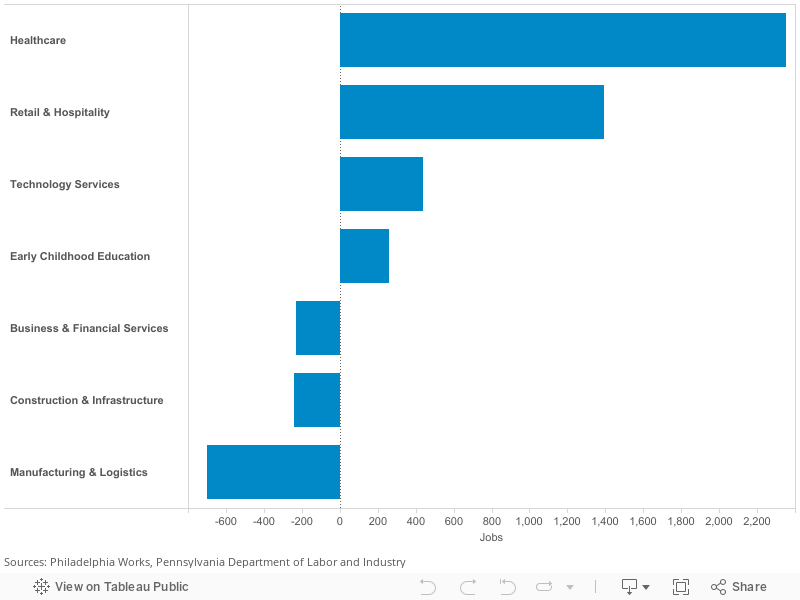
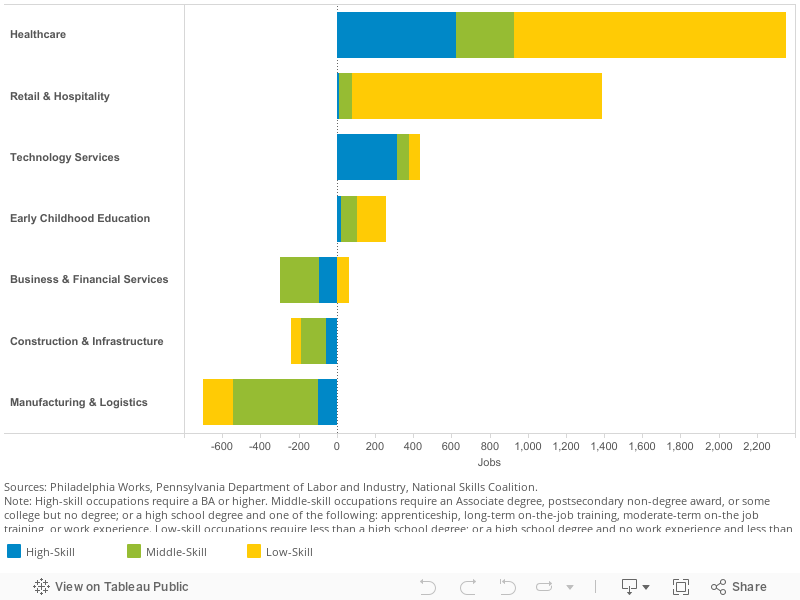
Review of labor data suggests that this trend has played out in Philadelphia as well. Job growth within the seven target sectors in the city between 2006 and 2016 was driven entirely by gains in the number of low-skill, low-wage jobs and high-skill positions with extensive educational requirements. The number of middle-skill jobs in these sectors in Philadelphia actually dropped by 2,500 over the past decade. It is worth noting that some of the disparity in growth between low-skill and middle-skill employment during this period may be attributable to differential impacts of the Great Recession. Despite this overall trend, middle-skill jobs have grown modestly in some sectors, and strong overall growth in sectors that rely on middle-skill workers suggests that there will continue to be opportunities for these individuals. However, the landscape of middle-skill employment is quickly evolving as the broader economy continues to transform. This evolution presents both challenges and opportunities from a workforce development perspective, as educational and training requirements change, new occupations emerge, and cross-sector career pathways become increasingly viable.
With scale, growth, and job opportunities across skill levels, the Healthcare sector presents a unique opportunity to support growth with equity.
As the largest sector by employment in Philadelphia, the Healthcare sector presents a range of opportunities across skill levels. Healthcare added the most jobs of the target sectors over the past decade, including net growth of 3,000 middle-skill positions.
What is more, Healthcare proved to be a relatively stable sector during the recession. While it is not immune to economic downturns—and is subject to the effects of regulatory uncertainty and changes—healthcare employment is driven more by demographics than cyclical economic conditions. Looking ahead, the growth of the aging population in our region is likely to drive growth in demand. Combined, these factors translate into a relatively stable environment for applying long-term workforce strategies.
While Healthcare has seen growth in middle-skill jobs, the preponderance of job creation in the sector over the past decade was in low-skill, low-paying jobs. The fastest-growing subindustry has been services for the elderly and disabled and the occupations adding the most jobs are personal care aides and home health aides, which together account for 22,000 jobs but pay between $20,000 and $22,000 per year.
Although pay is low for these two large and growing occupations, they require little in the way of education or training. And the scale of employment in these occupations provides reason to further explore the investment and infrastructure needed to help individuals in these personal care occupations move into middle-skill jobs throughout the Healthcare sector. Our city and region already benefit from strong Healthcare training infrastructure built around clearly demonstrated career pathways. With employment growth projected to continue, there is opportunity to expand the good work already being done to connect individuals to opportunity both in growing middle-skill jobs as well as low-skill jobs that could serve as on-ramps to career advancement.
Some sectors present opportunities at scale, but face limitations for intra-sector career pathways.
The Retail & Hospitality sector and the Business & Financial Services sector employ a significant number of workers and are home to some large and growing low-skill occupations that provide opportunity for many Philadelphians. In Retail & Hospitality, 83% of jobs are low-skill and an even higher share of new job creation in recent years has been concentrated in these low-skill occupations. However, with low-skill jobs accounting for such a high share of sector employment—and a corresponding small share of middle-skill and high-skill jobs within the sector—the prospects for career advancement within the Retail & Hospitality sector are limited. While training can help some individuals advance to managerial positions, the small number of middle-skill jobs in the sector presents some challenges in creating intra-sector career pathways at scale.
A related challenge manifests in the Business & Financial Services sector. During the past decade, the largest absolute job gain was among security guards. Employment in that occupation increased from 3,392 in 2006 to 6,998 in 2016, even as sector-wide employment declined during that span. However, as in Retail & Hospitality, the career pathway for security guards within the Business & Financial Services sector is not entirely clear, and employment has declined in many of the traditional middle-skill jobs in that sector during the past decade.
Still, the sheer scale of job growth in low-skill occupations creates an impetus to consider broader, flexible approaches. Low-skill jobs do not necessarily have to be dead-end jobs. More robust partnerships between workforce development groups, labor unions, and model employers in the city could yield more low-skill jobs with higher pay and benefits, coupled with additional training. Furthermore, career pathways that enable workers to advance from low-skill jobs to middle-skill opportunities do not necessarily have to be confined to a single sector. With supplemental training and education, foundational job experience in hospitality or as a security guard can provide critical skills in communication and problem-solving that employers across sectors seek in employees.
Early Childhood Education and Technology Services, while small, are fast-growing sectors that provide middle-skill opportunities and benefit from considerable support and momentum.
Early Childhood Education and Technology Services, which combine for nearly 24,000 jobs in Philadelphia, do not provide the same scale of opportunity as Healthcare or Retail & Hospitality, but both are high-growth fields that stand to benefit further from growing attention and support. Both sectors provide opportunities for middle-skill workers—tech supported 4,800 middle-skill jobs in 2016 and early childhood education supported 2,900—and the number of these opportunities is expected to rise as both sectors continue to grow.
What is more, the City’s commitment to PHLpreK is likely to result in significantly higher growth and demand for workers in Early Childhood Education than estimated in official projections. And while this will translate into more opportunities for low-skill and middle-skill workers, average pay for childcare workers and preschool teachers is relatively low. Workforce efforts in this sector will need to focus on providing support for these workers to progress along career pathways into jobs that provide family-sustaining wages. As the sector grows, it will be important to better articulate viable career pathways for early childhood workers.
On the other hand, Tech Services is the focus of much activity and research in the city and region, as the sector has been among the fastest-growing in the city and region over the past decade. Tech Services does support a considerable base of middle-skill jobs, but most job creation in the sector over the past decade has been concentrated at the high end of the skill spectrum. As a whole, hiring in tech is often subject to upcredentialing, as many job postings include far more in the way of educational and technical requirements than actually needed to perform the job. To address this, there is opportunity to work with employers and HR professionals to expand recruitment, screening, and hiring practices to allow for the consideration of qualified but non-traditional candidates for middle-skill and high-skill positions. Reducing upcredentialing could help mitigate both the difficulties that tech employers are having filling positions and challenges in connecting more middle-skill workers to well-paying jobs. The City’s “City as Model Employer” initiative could be fertile ground for this approach.
Traditional blue-collar sectors remain strong sources of middle-skill jobs, but face headwinds that will present challenges in achieving scale.
Construction & Infrastructure and Manufacturing & Logistics are the only target sectors that support more middle-skill jobs than low-skill or high-skill jobs, as about 45% of positions in each sector are middle-skill. And average pay in both sectors is well above the citywide average, at $87,700 for Construction & Infrastructure jobs and $73,500 for Manufacturing & Logistics jobs.
But while they remain solid sources of well-paying, middle-skill jobs, both sectors have contracted over the past decade. Employment has rebounded in recent years, though the macroeconomic forces of automation and globalization are expected to continue exhibiting downward pressure on sectoral employment. The early effects of automation on manufacturing jobs are already evident and expected to grow, and the full impact on logistics jobs of the growth of autonomous vehicles is not yet fully understood but expected to be significant.
Despite limited projected growth, replacement openings will provide opportunities for new workers to enter the workforce in both sectors. While the Manufacturing & Logistics sector is expected to experience modest job loss through 2024, projections anticipate that the sector could see just over 1,100 replacement openings annually during this period. Nearly half (45%) of these openings are projected to be for middle-skill positions. With a smaller employment base, fewer replacement openings (413 annually) are projected for Construction & Infrastructure. Approximately one-third of these openings are projected to be for middle-skill positions.
Furthermore, these sectors have strong and well-structured training infrastructure that may be well positioned to provide targeted support for individuals to take advantage of replacement openings, even as net job growth in these sectors stagnate or decline. And in considering the broader workforce strategy, the existing training infrastructure in these two traditional middle-skill sectors may well serve as models for other sectors. Apprenticeships, for example, have long been part of the training approach employed for manufacturing and construction jobs, but are still relatively limited in other sectors.
HOW DO THE TARGET SECTORS COMPARE?
SIZE
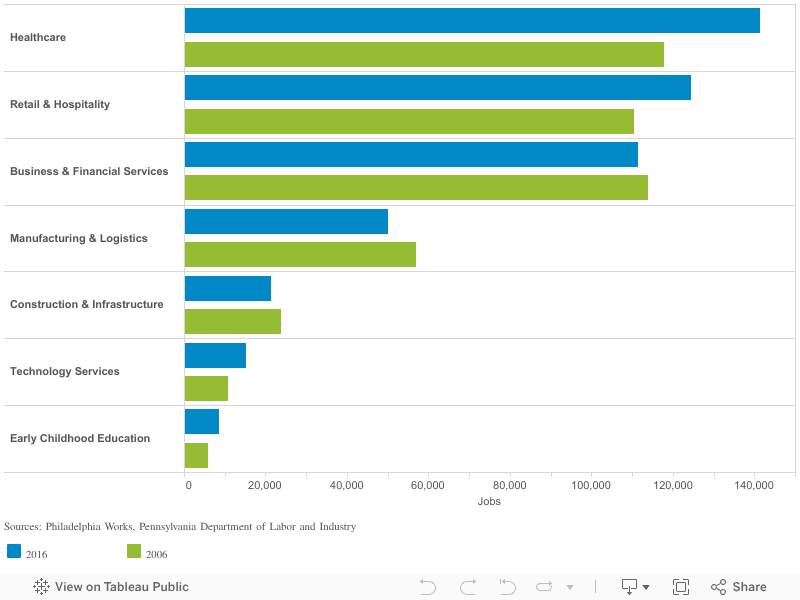
In 2016, the seven target sectors accounted for 472,000 jobs in the city of Philadelphia, representing 71% of all jobs in the city. Employment is dominated by the Healthcare, Retail & Hospitality, and Business & Financial Services sectors, which each account for more than 100,000 jobs. Combined employment in these three sectors represents 80% of all jobs in the target sectors. On the other side of the spectrum, three small sectors—Early Childhood Education, Construction & Infrastructure, and Technology Services—account for a combined 45,000 jobs, or 10% of all jobs in the target sectors. Manufacturing & Logistics is the lone mid-sized sector, with 50,000 jobs.
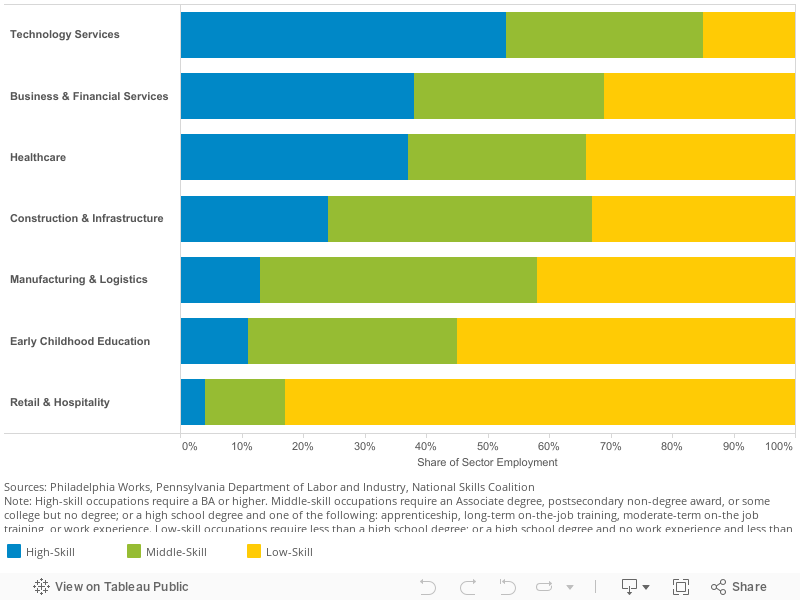
The target sectors vary in the composition of employment across skill levels. Traditional blue-collar sectors like Manufacturing & Logistics and Construction & Infrastructure still have the highest share of middle-skill jobs among sectors, with slightly more than 40% of jobs in each sector classified as middle-skill. Approximately one-third of the workforces in Technology Services, Business & Financial Services, Early Childhood Education, and Healthcare are employed in middle-skill jobs. Retail & Hospitality supports the lowest share (13%) of middle-skill jobs among the target sectors.
GROWTH
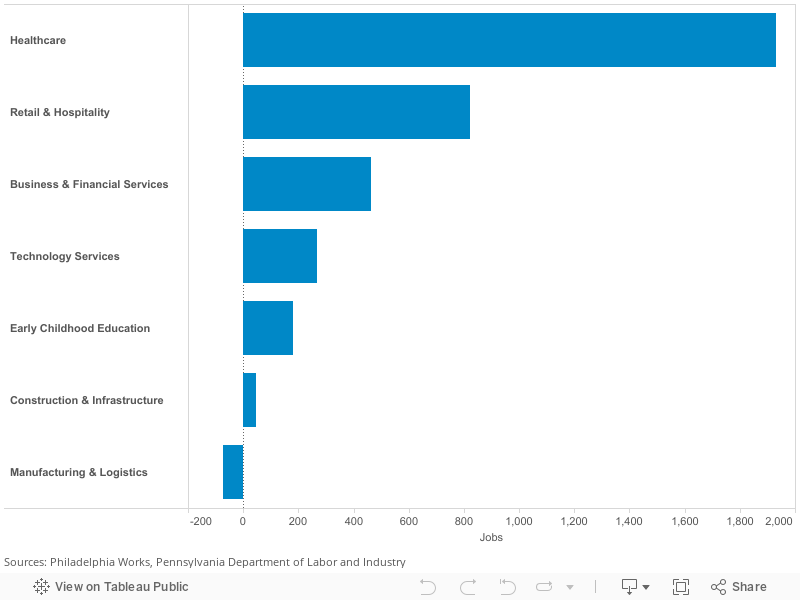
Philadelphia employment increased in four of the seven target sectors between 2006 and 2016. The Healthcare sector added the most jobs over this period, creating an average of 2,400 new jobs every year. The Retail & Hospitality sector added the second-highest number of jobs during the same period, with an average of 1,400 new jobs each year. The two smallest sectors in size—Technology Services and Early Childhood Education—also grew, adding a combined 700 jobs per year during the past decade. Three sectors—Business & Financial Services, Manufacturing & Logistics and Construction & Infrastructure—experienced net job losses during the past decade, following similar long-term trends at the metro, state, and national levels. For comparison, the annual average of net new jobs added across all of Philadelphia was around 3,000 during the past ten years.
Narrowing analysis of labor data to the three years between 2013 and 2016—and thereby avoiding the most direct effects of the recession—reveals more robust growth across all target sectors. Technology Services saw the greatest change between ten-year and three-year growth trends, with 1,110 jobs created per year between 2013 and 2016 despite being the smallest sector in size. Business & Financial Services rebounded significantly, shifting from net loss over the 10-year period to adding an average of 1,500 jobs per year since 2013. Construction & Infrastructure and Manufacturing & Logistics also added jobs during the past three years, in contrast to net losses experienced for both sectors over the ten-year period. For comparison, the annual average of all net new jobs added in Philadelphia was around 10,000 during the past three years.

While traditional blue-collar sectors like Manufacturing & Logistics and Construction & Infrastructure still have the highest share of middle-skill jobs among sectors, more than half of job losses in these sectors over the past decade was concentrated among middle-skill jobs. In Technology Services, Business & Financial Services, Early Childhood Education, and Healthcare job growth during the past decade was largely concentrated in low-skill and high-skill jobs, rather than middle-skill jobs. Still, in absolute terms, the Healthcare sector added the most middle-skill jobs among target sectors during the past decade. And despite its small size, Early Childhood Education added the second-most middle-skill jobs during the same period.
PROJECTIONS
Going forward, projections indicate that six of the seven target sectors should grow through 2024, but the number of jobs added annually is expected to ease slightly from the figures in recent years. Healthcare and Retail & Hospitality—the two largest sectors—are expected to lead the way in job creation in the city, followed by Business & Financial Services and Technology Services. Only the Manufacturing & Logistics sector is expected to lose jobs, though the pace of job loss is projected to slow to just 10% of losses experienced over the past decade. Construction & Infrastructure employment is expected to grow slightly, but not nearly at the pace of the past three years.
In addition to net new job growth, job openings will arise in the target sectors as current workers change careers and retire. Retail & Hospitality, known for substantial turnover, is projected to see the largest number of replacement openings. Beyond Retail & Hospitality, the projected number of replacement openings per sector is largely a function of total employment in the sector. Healthcare is projected to see the second-most replacement openings, followed by Business & Financial Services, Manufacturing & Logistics, and Construction & Infrastructure. While replacement openings add to projected robust net new job creation in sectors like Healthcare, Retail & Hospitality, and Business & Financial Services, they also provide workforce opportunities in sectors projected to contract or grow slowly, such as Manufacturing & Logistics and Construction & Infrastructure.
PROJECTED REPLACEMENT OPENINGS, PHILADELPHIA (ANNUAL AVERAGE, 2016-2024)
WAGES
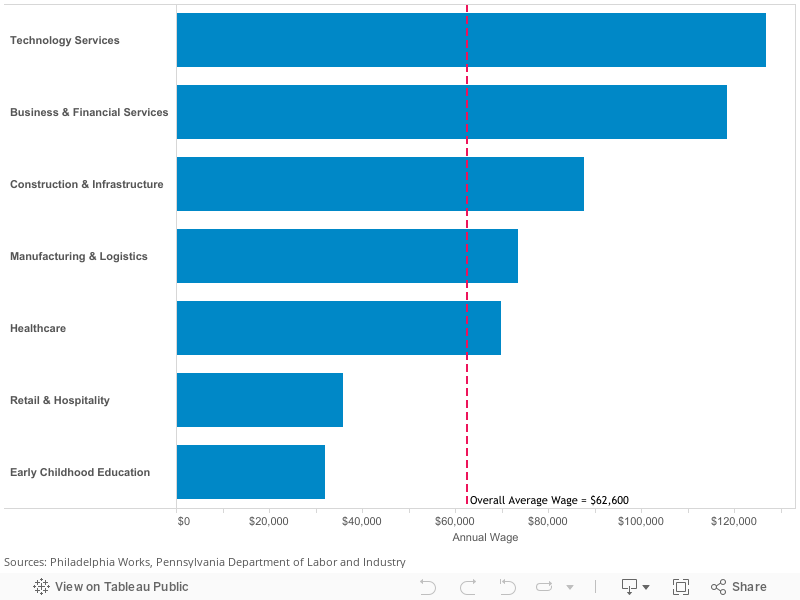
In 2016, the overall mean annual wage for individuals working in Philadelphia was $62,600, slightly higher than the mean annual wage of $59,400 at the metro level. On average, five of the seven sectors pay above average wages at both the city and metro levels. Technology Services jobs pay the most, on average, with a mean annual wage of $126,700 in the city, followed by Business & Financial Services at $118,300. After those sectors, there is a drop-off to a second tier of sectors—Healthcare, Manufacturing & Logistics, and Construction & Infrastructure—in which the mean annual wage ranges from approximately $69,900 to $87,800. The remaining sectors of Retail & Hospitality and Early Childhood Education are the lowest-paying target sectors, with a mean annual wage of $35,900 and $32,100, respectively, both well below the overall average wage for the city.
AVERAGE ANNUAL WAGE, PHILADELPHIA (2016)
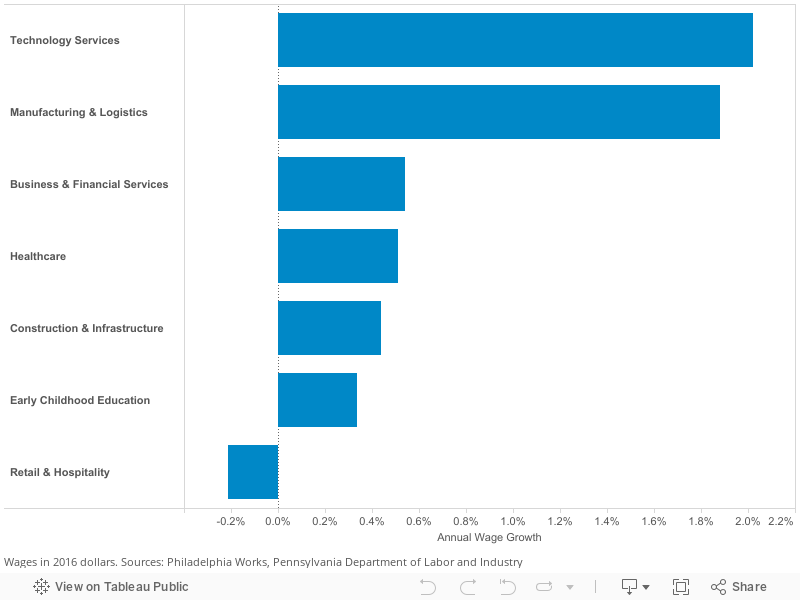
Real wage growth over the past decade has been slow, with the overall average wage for workers in Philadelphia increasing by an annual average of 0.5% between 2006 and 2016. In Philadelphia, wage growth in Business & Financial Services, Technology Services, and Manufacturing & Logistics outpaced the overall growth rate during the past decade, although the remaining target sectors lagged the overall wage growth rate in the city. One sector—Retail & Hospitality—experienced a slight decline in real wages between 2006 and 2016.
REAL WAGE GROWTH, PHILADELPHIA (10-YEAR ANNUAL AVERAGE, 2006-2016)
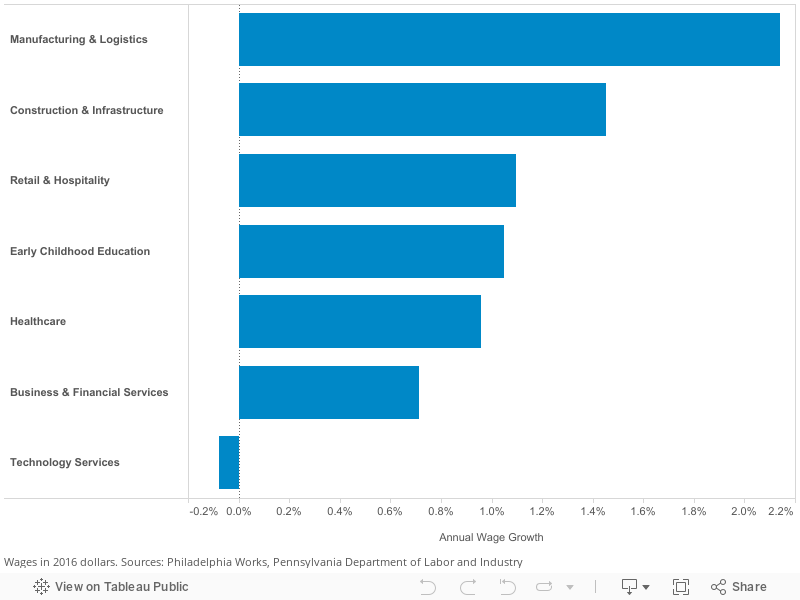
Wage growth accelerated in most sectors during the past three years. Wages grew most quickly in Manufacturing & Logistics and Construction & Infrastructure. Wage growth in three other sectors—Retail & Hospitality, Early Childhood Education, and Healthcare—outpaced the 0.8% overall annual average wage increase for workers in Philadelphia, and wage growth in Business & Financial Services accelerated compared with growth in prior years. Following rapid growth during the past decade, average wages were flat in Technology Services during the past three years.
REAL WAGE GROWTH, PHILADELPHIA (3-YEAR ANNUAL AVERAGE, 2013-2016)
A DEEPER LOOK AT THE TARGET SECTORS

HEALTHCARE
The Healthcare sector—accounting for 21.3% of total employment in Philadelphia—includes core industries such as hospitals, physicians’ offices, home health care services, and nursing care facilities. The sector also includes industries that are part of the supply chain or end-product delivery, such as medical equipment wholesalers, optical goods stores, and health and personal care stores.
With more than 140,000 jobs in Philadelphia, Healthcare is the largest of the target sectors. It also added the most jobs among target sectors in recent years with an annual average of 2,400 new jobs since 2006. At $70,000, the average annual healthcare salary is more than 12% higher than the average salary in Philadelphia. The sector supports a balanced mix of jobs by skill level, with middle-skill jobs accounting for 29% of all jobs in the sector.
Job growth in the largest subindustry, general hospitals, has been sluggish during the past decade, with the fastest growth in services for the elderly and disabled. With the expansion of the services for the elderly and disabled subindustry, the sector has seen a surge in job growth in several low-skill, low-paying occupations such as personal care aide and home health aide, which together added more than 1,100 jobs annually during the past decade. At the same time, Healthcare also added the most middle-skill jobs among target sectors in recent years, with occupations such as nursing assistants, vocational nurses, and medical assistants experiencing modest growth. The largest occupation—registered nurses—accounts for more than 21,000 jobs in the city and has added more than 200 jobs annually since 2006.

RETAIL & HOSPITALITY
The Retail & Hospitality sector—accounting for 18.7% of total employment in Philadelphia—includes core industries in retail trade, entertainment, and recreation, as well as accommodation and food services. The sector also includes other industries like movie theaters, rental centers, travel agencies, and janitorial services which are not formally categorized among the core industries but share similar workforce needs.
Retail & Hospitality is the second-largest target sector with more than 124,000 jobs in Philadelphia. The sector added the second-largest number of jobs among target sectors during the past decade, averaging 1,400 per year. Job growth accelerated during the past three years, with an average of 1,900 jobs added annually. While the sector has experienced notable job growth, the average salary of $36,000 is the lowest among target sectors. This low average salary is driven by an outsize share of low-skill jobs, which account for 83% of all jobs in the sector. Middle-skill jobs account for just 18% of jobs.
Job growth in the sector has largely been concentrated in hospitality subindustries, with restaurants adding more than 800 jobs annually during the past decade. Growth has been concentrated predominantly in low-skill occupations such as food preparation and serving workers, waiters and waitresses, and restaurant cooks. Supervisor positions account for many of the middle-skill job opportunities in the sector and offer better pay, though there are fewer of these jobs and growth has been slower. On the retail side of the sector, subindustries such as discount department stores and warehouse clubs experienced some growth, but the number of retail sales workers overall declined over the past decade.

BUSINESS & FINANCIAL SERVICES
The Business & Financial Services sector—accounting for 16.8% of total employment in Philadelphia—includes core industries in finance, insurance, real estate, professional services, and administrative and support services. The sector also includes industries that are part of the supply chain, such as office equipment wholesalers and office supply stores.
The third-largest target sector in the city with 112,000 jobs, Business & Financial Services has seen uneven growth over the past decade. The sector suffered significant adverse effects from the Great Recession, contributing to net job loss between 2006 and 2016. In recent years, however, the sector has rebounded strongly, adding an average of 1,500 jobs every year since 2013. With an average wage of $118,000, Business & Financial Services is the second highest-paying of the target sectors, and it exhibits a notable balance in diversity of job types, with high-skill jobs accounting for 38% of jobs and middle-skill jobs accounting for 31% of jobs.
Half of sector employment is concentrated in six large industries, and over the past decade, employment in several traditional large anchor subindustries such as commercial banking and law offices declined. The security guards and patrol services subindustry saw the most growth over the past decade, followed by temporary help services and consulting. Middle-skill jobs in this sector were particularly vulnerable during the past decade, as employment in occupations such as tellers, bookkeepers, and paralegals all declined. However, some low-skill occupations such as security guards—which pay slightly more than the typical low-skill, entry-level job—added a significant number of jobs during the past decade.

EARLY CHILDHOOD EDUCATION
The Early Childhood Education sector—accounting for 1.3% of total employment in Philadelphia—includes core industries such as child day care services, elementary schools, child and youth services, and educational support services. Occupational analysis allows for more targeted understanding of employment in elementary and secondary schools.
The Early Childhood Education sector is the smallest sector in Philadelphia with 8,600 jobs, but has grown quickly during the past decade. The sector added an average of nearly 260 jobs per year since 2006. The pace slowed slightly in recent years as approximately 234 jobs were created annually since 2013. A significant share of job growth has been concentrated in low-skill occupations, but the number of middle skill created in Early Childhood Education during the past decade was still the second most among target sectors. Although it has been one of the fastest-growing sectors, the average wage of $32,100 is lower than in all target sectors, including Retail & Hospitality.
Child day care services accounted for the vast majority of job growth among early childhood education subindustries. Occupations requiring less than a Bachelor’s degree, such as childcare workers and teacher assistants, led the sector in job creation, but these occupations also pay the least among early childhood education positions with a median annual salary in the low-$20,000 range. The number of pre-school teachers, a key middle-skill occupation, increased during the past decade, with a slightly higher median wage of nearly $29,000 per year.

TECHNOLOGY SERVICES
The Technology Services sector—accounting for 2.3% of total employment in Philadelphia—includes a range of core industries in software and hardware services, telecommunications, e-commerce, and biotechnology. The core industries draw from the definition used by CompTIA, the tech industry trade group.
Despite being the smallest of the target sectors in the city—supporting 15,000 jobs—Technology Services has grown faster than all other target sectors over the past decade and added a significant number of jobs. Since 2006, the sector has added an average of more than 400 jobs per year. Job growth accelerated rapidly during the past three years, adding more than 1,000 new jobs annually since 2013. At $126,000, the average wage in Technology Services is the highest among target sectors and more than double the average wage in Philadelphia. This is driven by a relatively high share of high-skill jobs (53%), though nearly one-third of jobs in the sector are middle-skill jobs.
Job growth has been concentrated in subindustries such as biotechnology, computer systems design, computer programming services, and internet publishing, which collectively added 470 jobs annually during the past decade. Employment in the largest subindustry—wired telecommunications carriers—has declined, as have jobs in accompanying large middle-skill occupations in telecommunications installations and repair. At the occupational level, high-skill occupations such as software developers and systems analysts saw the largest growth, and middle-skill occupations, such as computer support specialists, saw modest growth.

MANUFACTURING & LOGISTICS
The Manufacturing & Logistics sector—accounting for 7.5% of total employment in Philadelphia—includes core industries in manufacturing, transportation, and distribution. The sector also includes a range of related industries that are part of the supply chain, end-product delivery, or which provide critical support services. Examples include motor vehicles supplies wholesalers, industrial machinery repair, and commercial transportation equipment rental.
Manufacturing & Logistics is the fourth-largest target sector with 50,000 jobs. Jobs in this sector pay well, with an average wage of $74,000, and 45% of jobs are middle-skill. However, the employment base continued to erode over the past decade as the sector lost an average of nearly 700 jobs per year. Employment rebounded significantly following the recession, with an average of 428 jobs added per year between 2013 and 2016.
Recent growth in the sector has been concentrated largely in logistics subindustries such as air transportation, delivery services, and other ground transportation services. Large occupations with connections to these subindustries, such as stock movers and bus drivers, added jobs during the past decade. In manufacturing, subindustries such as meat processing and petroleum refineries experienced growth in recent years, but this was offset by larger losses in subindustries such as pharmaceutical manufacturing, commercial printing, and commercial bakeries. Sizeable middle-skill manufacturing occupations such as team assemblers and welders shed jobs during the past decade.

CONSTRUCTION & INFRASTRUCTURE
The Construction & Infrastructure sector—accounting for 3.2% of total employment in Philadelphia—includes all traditional construction industries as well as a range of related industries that are part of the supply chain, end-product delivery, or which provide critical support services for construction and infrastructure work. Examples of additional industries include cement manufacturing, home centers, and architectural and engineering services.
Construction & Infrastructure is the second-smallest target sector in the city, supporting 21,000 jobs. On average, these jobs pay well—at $87,000 per year, Construction & Infrastructure is the third-highest paying of target sectors. More than two out of five jobs (43%) in the sector are middle-skill. As the sector most directly affected by the collapse of the housing market and the Great Recession, Construction and Infrastructure experienced job loss over the past decade, shedding an average of approximately 240 jobs per year since 2006. Employment has rebounded with the resurgence of development activity in the city, with employers adding an average of just over 470 jobs per year since 2013.
During the past decade, the largest subindustries—plumbing and HVAC contractors, engineering services, and architectural services—all saw job losses, although general contractor subindustries expanded modestly despite the impact of the recession. Employment in the majority of occupations—70% of which are available with less than a Bachelor’s degree—declined during this period, with sizeable middle-skill occupations such as plumbers, electricians, carpenters all experiencing net losses. Construction laborers, one of the better paying low-skill occupations, grew slightly during the past decade.
PROMISING LOW-SKILL OCCUPATIONS
While there are compelling middle-skill job opportunities in Philadelphia, net job growth within the seven target sectors in the city over the past decade was driven predominantly by gains in the number of low-skill jobs. To better understand the occupational dynamics underlying this trend, the Economy League conducted supplemental analysis of notable low-skill occupations in Philadelphia.