INDUSTRY ANALYTICS - BUSINESS & FINANCIAL SERVICES
The Business & Financial Services sector—accounting for 16.8% of total employment in Philadelphia—includes core industries in finance, insurance, real estate, professional services, and administrative and support services. The sector also includes industries that are part of the supply chain, such as office equipment wholesalers and office supply stores.
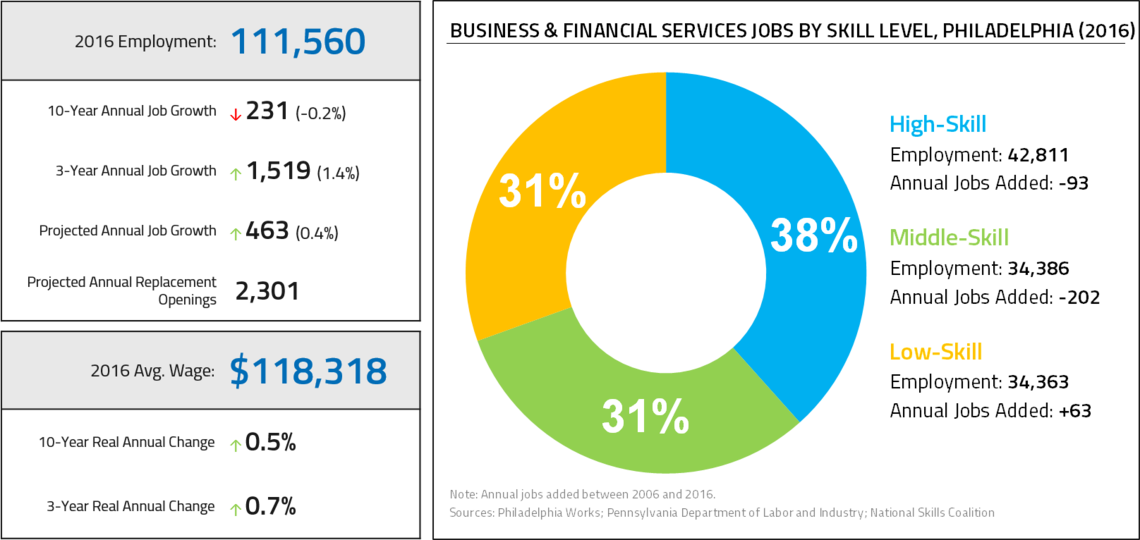
The third-largest target sector in the city with 112,000 jobs, Business & Financial Services has seen uneven growth over the past decade. The sector suffered significant adverse effects from the Great Recession, contributing to net job loss between 2006 and 2016. In recent years, however, the sector has rebounded strongly, adding an average of 1,500 jobs every year since 2013. With an average wage of $118,000, Business & Financial Services is the second highest-paying of the target sectors, and it exhibits a notable balance in diversity of job types, with high-skill jobs accounting for 38% of jobs and middle-skill jobs accounting for 31% of jobs.
Half of sector employment is concentrated in six large industries, and over the past decade, employment in several traditional large anchor subindustries such as commercial banking and law offices declined. The security guards and patrol services subindustry saw the most growth over the past decade, followed by temporary help services and consulting. Middle-skill jobs in this sector were particularly vulnerable during the past decade, as employment in occupations such as tellers, bookkeepers, and paralegals all declined. However, some low-skill occupations such as security guards—which pay slightly more than the typical low-skill, entry-level job—added a significant number of jobs during the past decade.
- The Business & Financial Services sector is the third-largest target sector in Philadelphia.
- The sector was particularly impacted by the Great Recession, and employment is still not back to 2006 levels.
- Employment is spread relatively evenly across skill levels, but middle-skill jobs accounted for an outsize share of net job losses during the past decade.
- Sector job growth in Philadelphia lagged the metro, state and nation over the past decade.
- Hiring has picked up considerably in recent years, with firms adding an average of 1,500 jobs per year since 2013.
- At an average of 1.4% per year, the pace of hiring in Philadelphia in this sector since 2013 has exceeded metro and state rates, but lagged the national growth rate.
- The relative concentration of Business & Financial Services employment in Philadelphia is slightly higher than the national average, but it has declined over the past decade.
- The mean annual wage for Business & Financial Services jobs in Philadelphia was $118,300 in 2016, up from $112,300 (2016 dollars) a decade ago and considerably higher than the mean annual wage for the sector at the metro, state, and national levels.
- Over the past decade, wages increased by an annual average of 0.5%, slower than growth in comparison geographies.
- Wage growth picked up slightly in the past three years, but was still slow at 0.7% annually, on average.
- The pace of hiring in Business and Financial Services is projected to decelerate through 2024, with annual growth expected to average 0.8%.
- Projections indicate that approximately 3,700 net new jobs will be added through 2024—or 463 jobs annually, on average.
- The sector is projected to have 2,301 replacement openings annually through 2024.
- The six largest subindustries in Business and Financial Services account for 50% of sector employment—55,000 jobs—and 24 industries in this sector employ at least 1,000 people.
- The Security Guards & Patrol Services subindustry added the most jobs over the past decade (389 per year), and growth is projected to continue.
- Commercial Banking lost the most jobs in the sector over the past decade (-386 annually) and continued to shed jobs in more recent periods.
- Consistent with national trends, legal employment declined over all periods.
- Security Guards represent the largest occupation in this sector, with 7,000 jobs in 2016.
- Employment in this occupation doubled over the past ten years (3,600 new jobs since 2006), but median pay is just $23,000 per year.
- Most other occupations saw minimal growth over the past decade. Accountants and Auditors added the second most positions, but resulted in a total of just 365 new jobs since 2006.
- Other large occupations saw declining employment, including Customer Service Representatives, all legal occupations (Lawyers, Paralegals, Legal Secretaries), Bookkeepers, and Bank Tellers.