INDUSTRY ANALYTICS - MANUFACTURING & LOGISTICS
The Manufacturing & Logistics sector—accounting for 7.5% of total employment in Philadelphia—includes core industries in manufacturing, transportation, and distribution. The sector also includes a range of related industries that are part of the supply chain, end-product delivery, or which provide critical support services. Examples include motor vehicles supplies wholesalers, industrial machinery repair, and commercial transportation equipment rental.
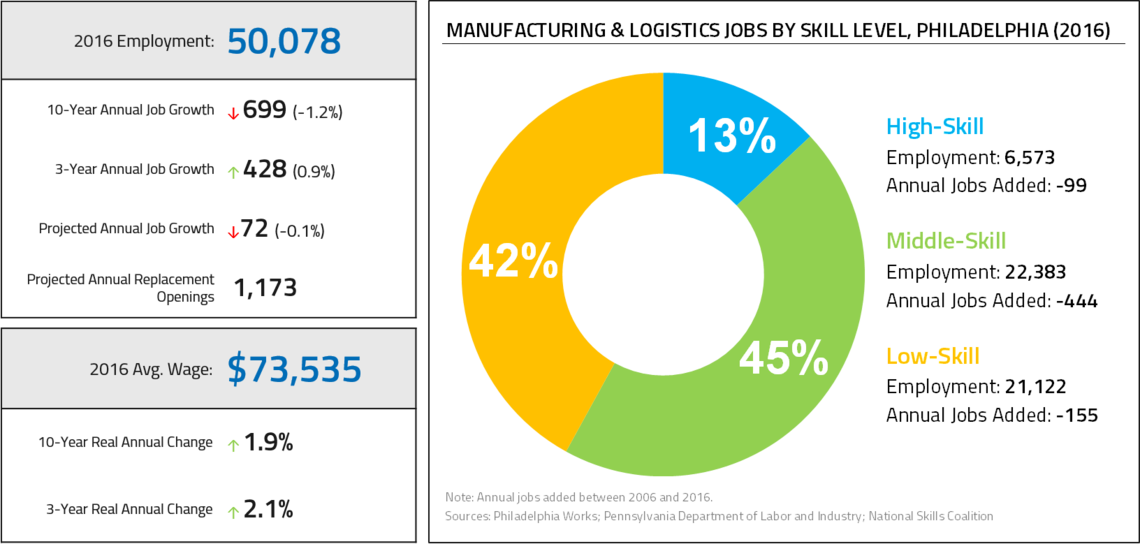
Manufacturing & Logistics is the fourth-largest target sector with 50,000 jobs. Jobs in this sector pay well, with an average wage of $74,000, and 45% of jobs are middle-skill. However, the employment base continued to erode over the past decade as the sector lost an average of nearly 700 jobs per year. Employment rebounded significantly following the recession, with an average of 428 jobs added per year between 2013 and 2016.
Recent growth in the sector has been concentrated largely in logistics subindustries such as air transportation, delivery services, and other ground transportation services. Large occupations with connections to these subindustries, such as stock movers and bus drivers, added jobs during the past decade. In manufacturing, subindustries such as meat processing and petroleum refineries experienced growth in recent years, but this was offset by larger losses in subindustries such as pharmaceutical manufacturing, commercial printing, and commercial bakeries. Sizeable middle-skill manufacturing occupations such as team assemblers and welders shed jobs during the past decade.
- Manufacturing & Logistics supported 50,000 jobs in Philadelphia in 2016, though the sector’s employment base shrunk by 12% over the past decade.
- While 45% of employment is concentrated in middle-skill jobs, 64% of job losses in this sector during the past decade were concentrated in middle-skill jobs.
- Sector employment rebounded between 2013 and 2016, adding a total of 1,300 net new jobs as the local economy emerged from the recession.
- Even as employment change turned positive over the past three years, the local pace of employment growth in the sector (0.9% annually) lagged the national rate (1.6%).
- The concentration of Manufacturing & Logistics employment in Philadelphia significantly lags the national rate and has declined over the past decade.
- The mean annual wage for Manufacturing & Logistics jobs in Philadelphia was $73,500 in 2016, up 19% from $61,900 (2016 dollars) a decade ago.
- Between 2006 and 2016, the average annual wage growth for the sector in Philadelphia (1.9%) outpaced metro, statewide, and national rates.
- Local wage growth over the past decade narrowed the gap between average city and statewide wages within the sector, though wages in Philadelphia still lag metro and national averages.
- Projections indicate that employment levels are expected to decrease slightly through 2024—an annual loss of approximately 72 jobs—but the pace of decline is expected to be significantly slower than during the past decade.
- Through 2024, annual sector employment in Philadelphia, the metro area, and the state is projected to decline by an annual average of 0.1%, while national sector employment is projected to grow by an annual average of 0.4%.
- The sector is projected to have 1,173 replacement openings annually through 2024.
- The largest industries in this sector are all in logistics, and most have added jobs since 2006.
- The 10,400 jobs in Scheduled Passenger Air Transportation (the largest subindustry) and Other Airport Operations (the sixth-largest subindustry) represent one-fifth of all sector employment.
- The two largest manufacturing industries in the city—Meat Processing (+25 jobs per year) and Petroleum Refineries (+109 jobs per year)—saw growth over the past decade.
- But other large manufacturing industries shed significant numbers of jobs, including Commercial Printing, Commercial Bakeries, and Pharmaceutical Manufacturing.
- The largest occupations in this sector are also in logistics.
- Among the five largest occupations, all added jobs except Heavy Truck Drivers.
- Laborers and Freight, Stock, and Material Movers is the largest occupation in this sector, supporting 5,000 jobs.
- The largest job growth was among Bus Drivers, School or Special Client, which also has minimal education requirements.
- The largest job losses occurred in manufacturing occupations such as Team Assemblers (-102 jobs per year), Sewing Machine Operators (-64 jobs per year), and Welders, Cutters, Solderers, and Brazers (-41 jobs per year).