Philadelphia’s Poverty Landscape: Progress, Persistent Disparities, and Pathways Forward
What You Need to Know:
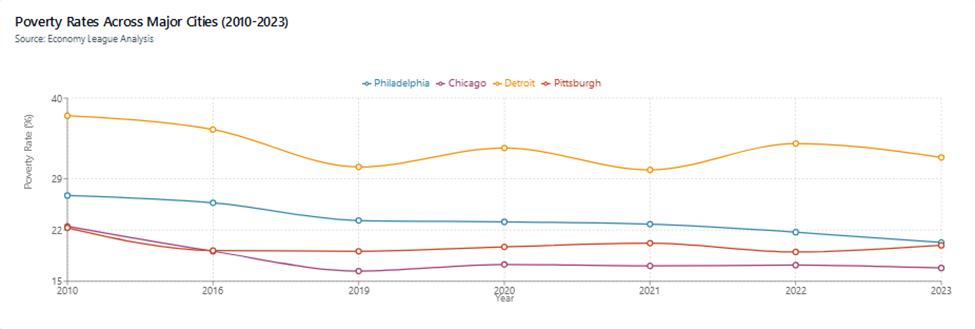
- Philadelphia’s overall poverty rate has markedly improved but remains high – Poverty decreased from 26.7% in 2010 to 20.3% in 2023, outperforming Detroit (31.9%) but still trailing Chicago (16.8%) and Pittsburgh (19.9%).
- Philadelphia’s poverty reduction remains marked by persistent racial disparities – Black poverty rates fell from 31.2% in 2010 to 24.5% in 2023, yet still substantially exceed the White poverty rate of 12.85%. Hispanic poverty remains persistently high, above 35%, notably higher than peer cities like Chicago (18.2%) and Detroit (28.6%). Asian poverty rates improved since 2010, settling between Black and White populations by 2023.
- Philadelphia’s poverty improvements reflect broader national trends, with some notable gaps compared to peer cities – Chicago achieved more consistent reductions across racial groups, especially among Hispanic and Black populations. Detroit, despite higher volatility, saw poverty rates converging across racial groups around 30%. Pittsburgh experienced persistent racial poverty gaps, particularly among Black residents.
- Factors influencing Philadelphia’s poverty landscape likely include: High concentration of poverty due to low housing costs and restricted suburban affordable housing; Deep-seated racial segregation and income disparities limiting economic mobility and Economic restructuring toward precarious service-sector and gig economy employment.
- Addressing poverty effectively in Philadelphia requires tackling systemic racial and economic inequities – Comprehensive strategies must address housing discrimination, educational disparities, job access, and historical economic racism to achieve sustained, equitable poverty reduction.
Understanding Poverty Rates and Overall Trends
The poverty rate is defined as the percentage of individuals or families whose annual income falls below the poverty line, a threshold set annually by the federal government that varies by family size and composition. Measuring poverty rates by racial groups is crucial for identifying disparities, understanding underlying structural inequalities, and designing targeted interventions to achieve equitable economic outcomes.
Philadelphia's overall poverty rate has notably improved, declining from 26.7% in 2010 to 20.3% in 2023—a substantial decrease of 6.4 percentage points. This trend contrasts sharply with Detroit’s more volatile yet persistently high poverty rates (37.6% in 2010 to 31.9% in 2023), Chicago’s steady but slower-paced decline (22.5% to 16.8%), and Pittsburgh’s relatively stable situation (22.3% to 19.9%).
Racial Disparities in Poverty Rates
Despite general improvements, Philadelphia's poverty trends by race depict a more complex and nuanced reality, especially when benchmarked against peer cities. For an interactive version of the graph please click here.
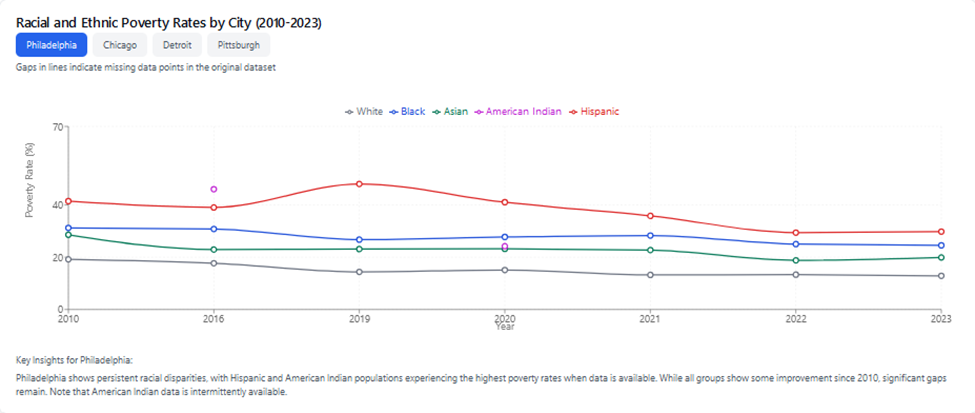
Hispanic Poverty: Philadelphia’s Hispanic community faces consistently high poverty rates, remaining above 35%, which is significantly higher compared to peer cities such as Chicago (18.2% in 2023) and Detroit (28.6% in 2023).
Black vs. White Poverty: Philadelphia has seen improvements in Black poverty rates, declining from 31.2% in 2010 to 24.5% in 2023. However, this figure remains markedly higher than the White poverty rate, which decreased from 19.2% to 12.85% during the same period.
Asian Poverty: The Asian community in Philadelphia initially experienced poverty rates comparable to those of Black residents. Over time, these rates have shifted downward, now positioned between Black and White poverty levels—a distinct pattern compared to Chicago, where Asian poverty rates align closely with those of Whites, and Detroit, where Asian poverty rates have shown extreme volatility.
Peer Cities’ Patterns and Comparisons
Pittsburgh: This city has exhibited persistent racial gaps.
- Black poverty rates have remained stubbornly high, fluctuating from 33.0% in 2010, declining temporarily to 27.1% in 2019, and rebounding to 33.0% by 2023.
- White poverty rates improved more steadily, dropping from 17.1% in 2010 to 13.3% in 2023.
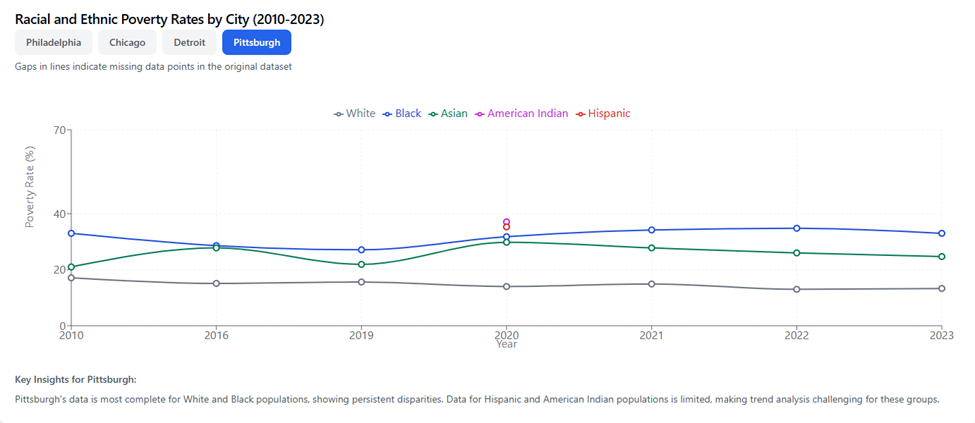
Pittsburgh’s difficulty in sustaining reductions in Black poverty indicates underlying economic vulnerabilities and potential deficiencies in targeted support measures.
Detroit: Detroit has been characterized by significantly higher and more volatile poverty rates across racial groups. Key observations include:
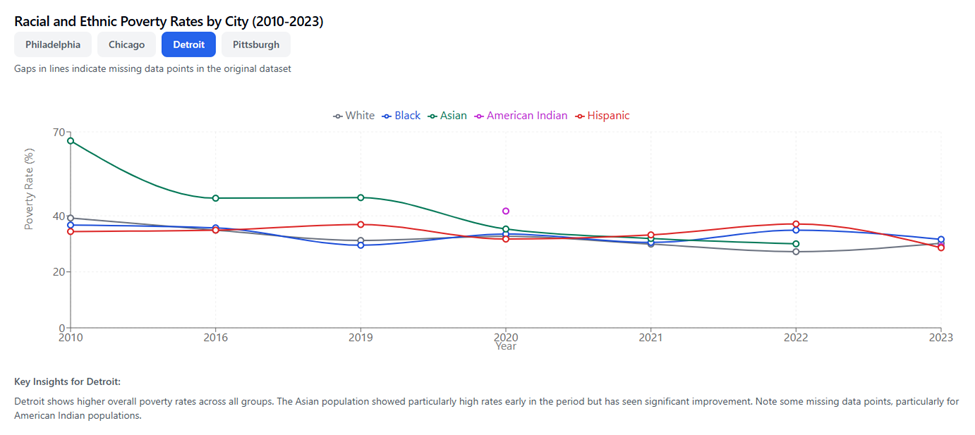
- Black poverty reduced from 36.7% in 2010 to 31.6% in 2023, while White poverty saw an even greater reduction from 39.2% to 30.2%, suggesting broader economic recovery affecting all racial groups.
- Asian poverty rates showed substantial volatility, sharply declining from an alarmingly high 66.8% in 2010 to approximately 30% by 2022, highlighting potentially effective but inconsistent economic interventions or demographic shifts.
- Hispanic poverty improved significantly from 34.4% in 2010 to 28.6% in 2023, positioning Detroit more favorably compared to Philadelphia’s persistently high Hispanic poverty rates.
- By 2023, Detroit’s poverty rates across racial groups converge around 30%, highlighting both substantial progress and persistent structural challenges that necessitate continued policy attention.
Chicago: Chicago has demonstrated notable success in reducing and stabilizing racial poverty disparities, outperforming peer cities. Key patterns, and possible reasons behind the same have been detailed below. It is critical to note that while there is some data to help ascertain specific racial patterns, reasons behind the racial disparities in the trends would require a more focused study.
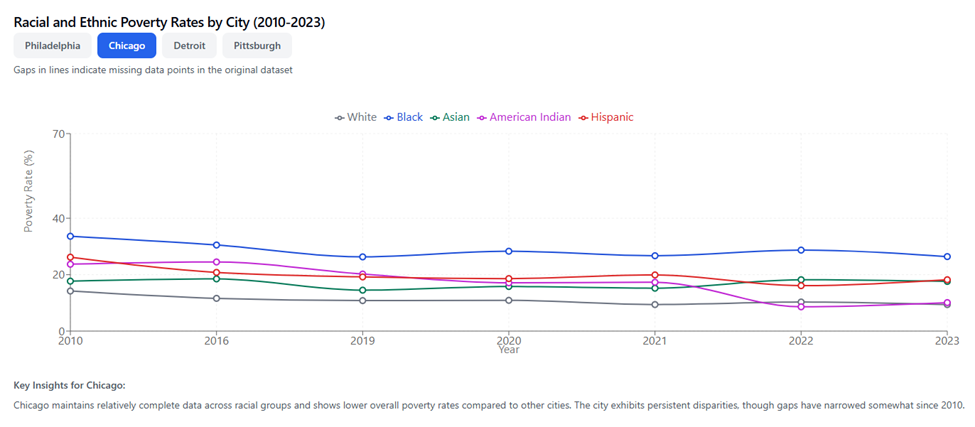
- Black poverty rates decreased steadily from 33.6% in 2010 to 26.4% in 2023, reflecting sustained investments and inclusive economic initiatives.
- White poverty rates significantly improved from 14.2% in 2010 to 9.4% in 2023, indicating broad-based economic strengthening.
- Hispanic poverty experienced substantial improvement, declining from 26.2% in 2010 to 18.2% in 2023. Specific reasons behind the same are unclea
- Asian poverty rates closely align with White poverty rates, highlighting equitable economic progress and distinctly contrasting the volatility observed in Detroit.
Understanding Poverty Trends in Philadelphia
Philadelphia’s declining poverty rate over the past decade is often seen as a sign of progress—but beneath the surface lies a more complex, uneven story.
- Concentration and Structure of Urban Poverty: Despite the progress of the last 15 years, Philadelphia still has the highest poverty rate among the ten largest cities in the U.S., with poverty concentrated disproportionately in communities of color. Lower housing costs and reliable public transit attract low-income residents to the city, while restrictive land use policies in the suburbs limit affordable housing development. This results in a spatial concentration of poverty within city limits, where opportunity is often out of reach for those who need it most (Federal Reserve Bank of Philadelphia, 2021; Hwang & Ding, 2020).
- Racial and Economic Segregation: Racial disparities are stark. The average Black resident lives in a neighborhood with a poverty rate nearly three times that of the average White resident. These divides are fueled by a legacy of redlining, unequal access to education, and persistent employment discrimination. Black and Hispanic households continue to earn significantly less than White households and often face more unstable housing, poorer schools, and fewer job opportunities (Philadelphia District Attorney's Office, 2023; Rothstein, 2017).
- Gentrification and Displacement: Some of the city’s poverty reduction is tied to demographic shifts driven by gentrification. Neighborhoods like Fishtown and Point Breeze have seen dramatic increases in income and home values, often accompanied by a shift from Black to White residents. While higher-income newcomers have changed the economic profile of these areas, long-term residents—especially those without financial or credit stability—are more likely to be displaced to lower-income neighborhoods. Research shows this displacement is racially unequal: Black families moving from gentrifying areas often land in similarly disadvantaged tracts, while White residents gain access to better-resourced neighborhoods (Hwang & Ding, 2020; PMC, 2016).
- Labor Market Shifts and Precarity: The city’s economic restructuring—from a manufacturing hub to a service-driven economy—has left many workers in low-wage, unstable jobs with few benefits. The rise of the gig economy has exacerbated this precarity, disproportionately affecting workers of color and those without higher education. Even with recent job growth and wage gains, too many Philadelphians remain locked in poverty due to structural weaknesses in the labor market (Philadelphia Mobility Action Plan, 2025; Philadelphia Quarterly Labor Market Report, 2025).
- Limited Upward Mobility: Despite some economic progress, mobility remains a serious concern. Raj Chetty’s research shows Philadelphia ranks among the worst major U.S. cities for helping children born into poverty climb the income ladder. For example, it ranks last in upward mobility for low-income White families and poorly for Black families, regardless of income. Just 16% of children born into poverty in the city are expected to escape it by their late 20s (Chetty et al., 2018; Chetty et al., 2024).
- Policy Response and Gaps: The city has made substantial investments—such as affordable housing initiatives, shallow rent subsidies, and eviction prevention—but these efforts, while impactful, are not enough to overcome entrenched disparities on their own. Without addressing root causes like housing segregation, education inequities, and racialized labor market barriers, progress will remain fragile and unequal (Philadelphia Mobility Action Plan, 2025; Federal Reserve Bank of Philadelphia, 2021).
Conclusion
Philadelphia’s poverty reduction is real—but it is driven as much by who is leaving and who is moving in as by true improvements for long-term residents. Racial and spatial inequalities remain deep, and upward mobility is still out of reach for too many. To build an inclusive economy, the city must invest not just in reducing poverty but in expanding mobility—especially for communities that have long been excluded from Philadelphia’s growth. That means directly confronting the structural barriers that shape where people live, how they work, and what futures are possible.
Bibliography
Baltimore Hunger Project. (2020). Root causes of poverty in the United States and Baltimore. https://www.baltimorehungerproject.org/wp-content/uploads/2020/10/Root-Causes-of-Poverty.pdf
Chetty, R., Dobbie, W., Goldman, M., Porter, S. R., & Yang, J. (2024). Creating opportunity in Philadelphia. Harvard University.
Chetty, R., Hendren, N., Jones, M. R., & Porter, S. R. (2018). Race and economic opportunity in the United States: An intergenerational perspective (NBER Working Paper No. 24441). National Bureau of Economic Research.
Economy League of Greater Philadelphia. (2025). Measuring well-being: Key micro-level indicators of economic resilience in Philadelphia. https://www.economyleague.org/resources/measuring-well-being-key-micro-level-indicators-economic-resilience-philadelphia-part-i
End Homelessness. (2021). Homelessness and Black history: Poverty and income. https://endhomelessness.org/blog/homelessness-and-black-history-poverty-and-income/
End Homelessness. (2025). Homelessness and racial disparities. https://endhomelessness.org/homelessness-in-america/what-causes-homelessness/inequality/
Federal Reserve Bank of Philadelphia. (2021). Poverty in Philadelphia and beyond. https://www.philadelphiafed.org
Hwang, J., & Ding, L. (2020). Unequal displacement: Gentrification, racial stratification, and residential destinations in Philadelphia. Stanford University.
Katz, B., & Turner, M. A. (2011). Who should run the city? Brookings Institution Press.
Lin, A. C., & Harris, D. R. (n.d.). The colors of poverty: Why racial & ethnic disparities persist. https://npc.umich.edu/publications/policy_briefs/brief16/PolicyBrief16.pdf
Philadelphia District Attorney's Office. (2023). Racial injustice report. https://phillyda.org
Philadelphia is 'America's poorest big city.' Here's what that actually means. (n.d.). https://whyy.org/articles/philadelphia-americas-poorest-big-city-poverty/
Philadelphia Mobility Action Plan. (2025). Upward mobility action plan. https://www.phila.gov
Philadelphia Quarterly Labor Market Report. (2025). https://philaworks.org/philadelphias-quarterly-labor-market-report-3/
PMC. (2016). Gentrification and residential mobility in Philadelphia. https://pmc.ncbi.nlm.nih.gov/articles/PMC5450830/
Rothstein, R. (2017). The color of law: A forgotten history of how our government segregated America. Liveright Publishing Corporation.