Measuring Well-Being: Micro Level Indicators – Access to Banking
This edition of Leading Indicators explores financial inclusion trends, specifically analyzing unbanked, underbanked, and fully banked household patterns across Philadelphia and peer cities Pittsburgh, Chicago, and Detroit from 2015 to 2023. Financial inclusion, defined as access to useful and affordable financial products and services, is pivotal for household economic resilience, enabling individuals to manage financial shocks, build wealth, and achieve sustained economic stability.
What you need to know:
- Philadelphia’s financial inclusion has significantly improved but remains vulnerable –
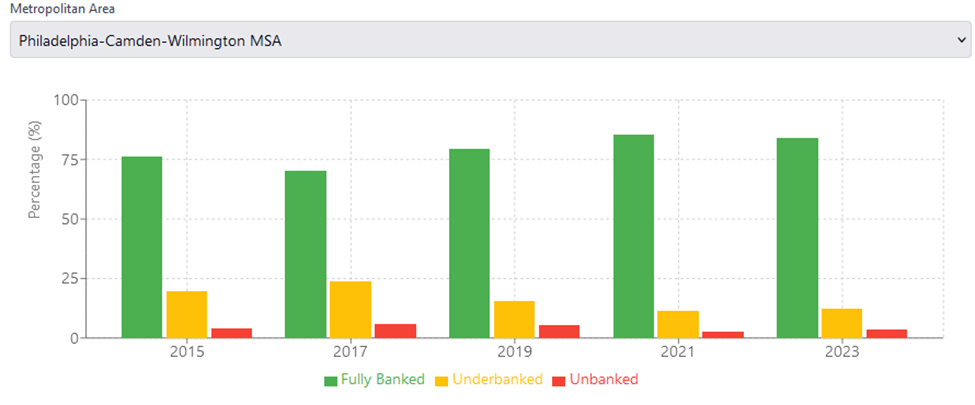
- The city's fully banked household rate rose notably from 76.1% in 2015 to 85.6% in 2021, before slightly dipping to 84.1% in 2023. Despite strong progress, recent economic disruptions highlight ongoing vulnerabilities.
- Underbanked rates declined consistently – Philadelphia’s underbanked households decreased significantly from 19.8% in 2015 to 12.3% in 2023, signaling improved access and adoption of comprehensive banking services.
- Unbanked populations fluctuate, reflecting economic vulnerability – Philadelphia’s unbanked rate fluctuated notably, declining from 4.1% in 2015 to a low of 2.8% in 2021, before rebounding to 3.7% in 2023, highlighting challenges linked to economic instability
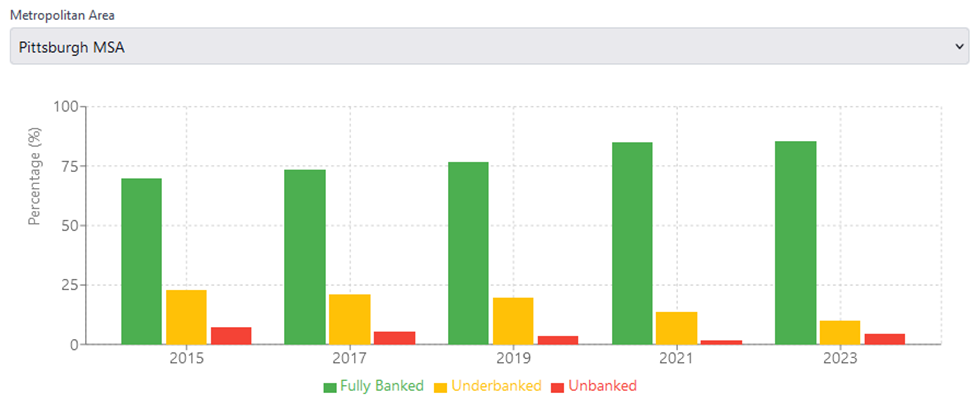
- Philadelphia outperforms Chicago and Detroit but trails Pittsburgh – Philadelphia’s overall improvement in fully banked households (76.1% to 84.1%) surpassed moderate gains seen in Chicago (77.1% to 81.1%) and Detroit (72.5% to 81.8%) but remains slightly behind Pittsburgh (70.0% to 85.4%), which achieved impressive growth.
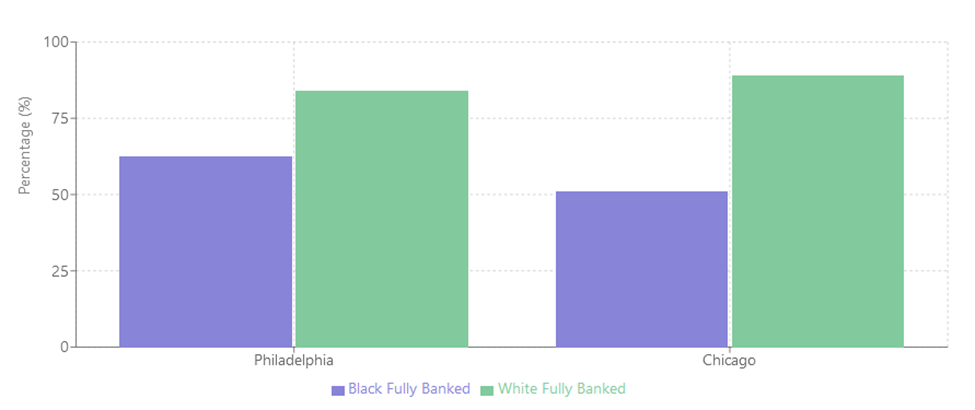
- Persistent racial disparities remain a significant concern – In 2015, Philadelphia’s White households were significantly more likely to be fully banked (83.9%) compared to Black households (62.5%). Limited updated data prevents comprehensive analysis but indicates ongoing racial inequities.
Why understand the status of Financial Inclusion?
Financial inclusion begins fundamentally with access to bank accounts, which serve as the gateway to broader financial services such as savings, credit, insurance, and secure payment systems. Possessing a bank account is critical, as it enables households to manage finances efficiently, safeguard their money securely, access loans or credit, build savings, and participate fully in the economic mainstream. Without this foundational access, households are left vulnerable, reliant on costly alternative financial services, and unable to effectively handle economic shocks or build long-term financial security.
Spread of banks across Philadelphia
Philadelphia's banking landscape is characterized by a diverse mix of financial institutions, with over 125 banks and more than 190 credit unions operating in the area.¹ However, no new banks have been established in Pennsylvania since 2013, largely due to stringent regulatory requirements and intense competition from larger banks and credit unions, such as Bank of America and Chase Bank.² This trend reflects a broader national decline in new bank formations, with fewer than 10 banks started annually in the U.S. since the 2008 financial crisis.³
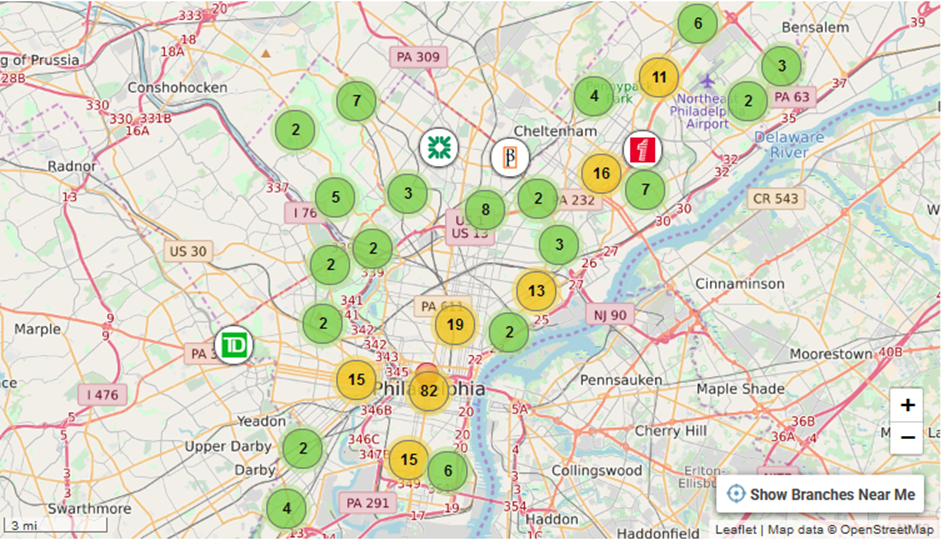
Figure 1: Spread of bank branches across the region. Source: BankBranchLocator.com
Major national banks such as Bank of America, Wells Fargo, and Chase Bank maintain a strong presence in Philadelphia, offering a wide range of financial services.⁴ Regional banks like PNC Bank also play a significant role, providing personalized services tailored to local needs.⁵ Community banks, including Hyperion Bank, focus on serving smaller communities and fostering local economic growth.⁶
Savings and Loan Associations are not prominent in Philadelphia, consistent with a broader national trend of decline in this type of institution.⁷ This decline stems from the Savings and Loan Crisis of the 1980s and 1990s, which caused widespread failures due to unsound real estate lending practices and deregulation.⁸ Public banks are also not yet operational in Philadelphia, though there are ongoing discussions about establishing a Philadelphia Public Financial Authority (PPFA) to serve underserved communities.⁹¹⁰
The PPFA differs from traditional banks as it would utilize the city's financial resources to facilitate loans and improve access to credit for disadvantaged communities. It could also partner with private financial institutions to guarantee loans.⁹¹⁰ Unlike conventional banks that offer checking or savings accounts, the PPFA would initially focus on providing financial tools such as letters of credit but may expand its services in the future.⁹¹⁰ As of April 2025, there is no recent update on the operational status or activities of the PPFA.
A biennial survey by the Federal Deposit Insurance Corporation (FDIC) categorizes households into three groups based on their banking status:
- Fully banked: Households that have a bank account and did not use alternative financial services in the past 12 months.
- Underbanked: Households that have a bank account but also used at least one alternative financial service in the past 12 months.
- Unbanked: Households that do not have a bank account.
Our analysis focuses primarily on the fully banked rate as a key indicator of complete banking access. Data for Philadelphia, Pittsburgh, Chicago, and Detroit were analyzed to identify trends over time and disparities across demographic groups. From 2010 to 2023, the percentage of fully banked households increased in all four cities, with an average improvement of 11.7 percentage points from 2015 to 2023.
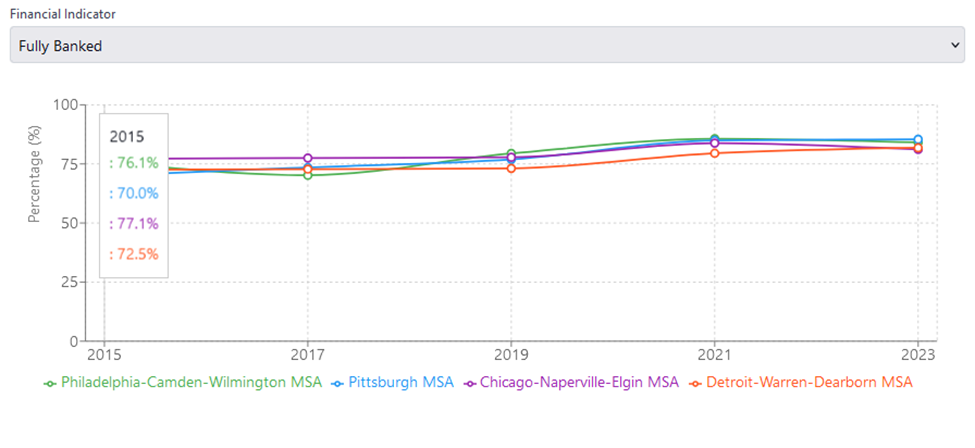
For an interactive version of the graph please click here - https://claude.site/artifacts/5034a4fe-d9a6-4ad0-8cc3-e9de67a006f4
Philadelphia's Performance: An Overview
Philadelphia demonstrated substantial progress in financial inclusion over the observed period. In 2015, only 76.1% of households were fully banked, with 19.8% underbanked and 4.1% unbanked. By 2021, Philadelphia showed remarkable improvement, with fully banked households rising to 85.6%, indicating significant success in expanding banking services and financial access. However, this trajectory slightly reversed in 2023, with fully banked households dipping slightly to 84.1%, possibly reflecting economic stresses caused by factors such as inflation, increased cost-of-living pressures, or residual impacts from the COVID-19 pandemic.
The city's underbanked population consistently decreased from 19.8% in 2015 to 12.3% in 2023, suggesting enhanced engagement with more comprehensive banking services. Nevertheless, the volatility in unbanked rates - dropping to a low of 2.8% in 2021 but rebounding to 3.7% in 2023 - highlights continuing vulnerabilities in financial access among certain population groups.
Comparison with Peer Cities
When comparing Philadelphia's trends to its peer cities—Pittsburgh, Chicago, and Detroit—distinct patterns emerge:
Pittsburgh experienced impressive improvements over this period. Fully banked households grew from 70.0% in 2015 to 85.4% in 2023, surpassing Philadelphia’s current level. Pittsburgh’s underbanked population also significantly declined from 22.7% to 10.1%, underscoring successful outreach efforts. However, its unbanked rates showed notable volatility, declining sharply to 1.6% in 2021 but sharply rising to 4.5% in 2023, reflecting similar economic vulnerabilities observed in Philadelphia.
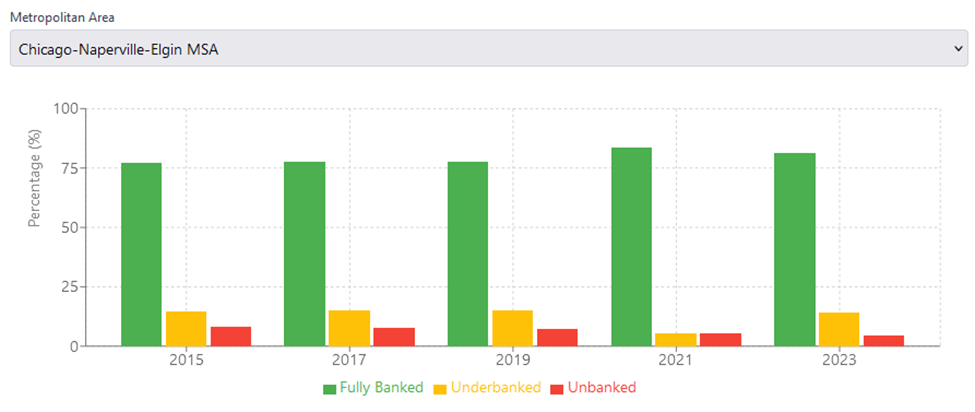
In contrast, Chicago exhibited moderate and fluctuating gains. The proportion of fully banked households increased from 77.1% in 2015 to only 81.1% in 2023, demonstrating slower and less consistent progress compared to Philadelphia and Pittsburgh. The city’s underbanked population barely declined, from 14.8% to 14.3%, suggesting limited success in moving households towards complete banking solutions. However, Chicago consistently reduced its unbanked rate from 8.1% in 2015 to 4.7% in 2023, marking a steady improvement.
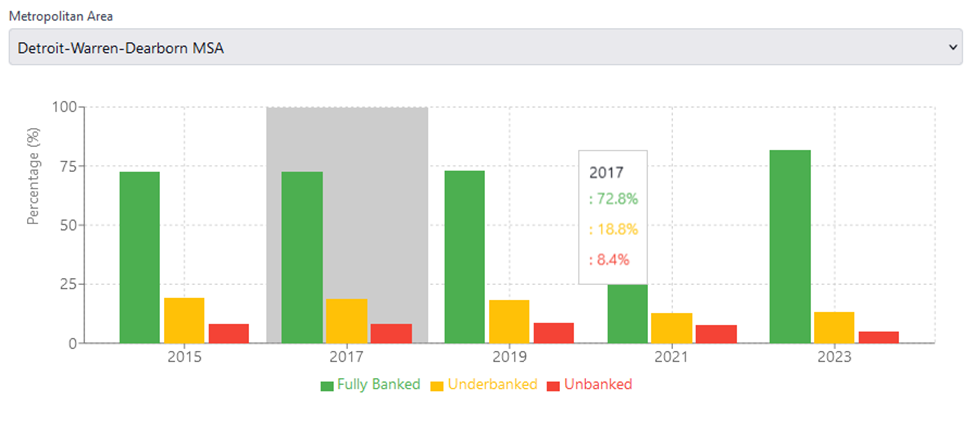
Detroit experienced substantial gains in banking access, increasing fully banked households from 72.5% in 2015 to 81.8% by 2023. While commendable, Detroit’s overall banking inclusion remains slightly behind Philadelphia and Pittsburgh. Underbanked populations decreased moderately from 19.4% to 13.2%, while unbanked rates steadily improved from 8.0% in 2015 to 5.0% in 2023, reflecting incremental yet steady progress.
Racial Disparities: Persistent Challenges
Despite overall gains, substantial racial disparities persist, as clearly documented in Chicago and Detroit due to their comprehensive racial datasets. (Access the interactive graph here - https://claude.site/artifacts/99e0f6f2-a326-482a-a489-76d561afb923)
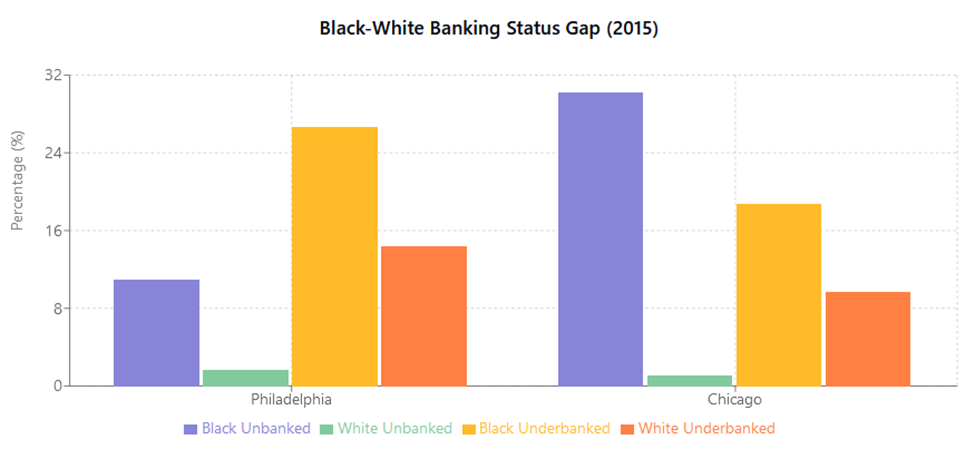
• In Philadelphia, fully banked rates in 2015 were notably higher among White households (83.9%) compared to Black households (62.5%). This indicates Black residents were 6.4 times more likely to be unbanked than White residents (10.9% vs. 1.7%). In Chicago, the disparity was even more pronounced, with Black residents 27.5 times more likely to be unbanked (30.2% vs. 1.1%).
• Significant gaps were also observed in fully banked rates. By 2023, Chicago’s White household banking rates consistently exceeded 90%, resulting in a stark 38.2 percentage point gap compared to the Black population. In Philadelphia, this gap was smaller but still substantial at 21.4 percentage points.
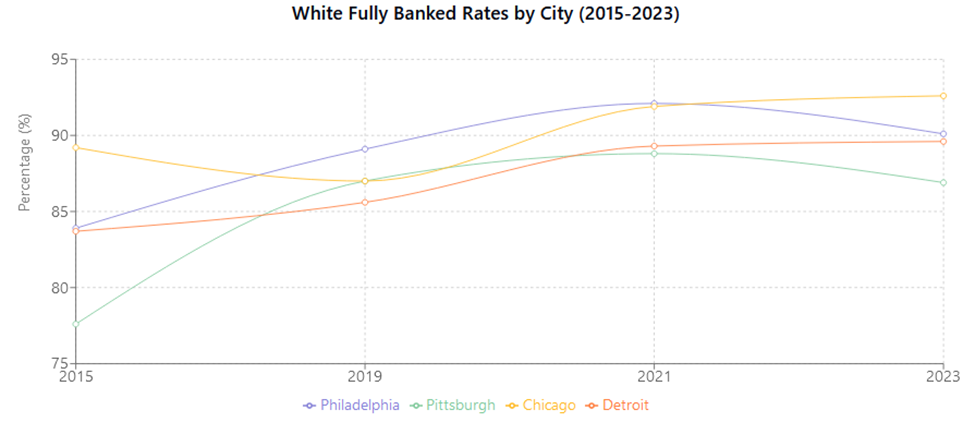
• Comprehensive data on financial inclusion was primarily available for White populations. Trends indicate significant improvement across cities, with fully banked rates for White households exceeding 90% by 2023 in all areas except Pittsburgh.
Factors Influencing Banking Patterns
Economic stability, targeted community outreach, and financial education initiatives have positively impacted financial inclusion. Philadelphia’s growth from 2015 to 2021 coincided with broader economic revitalization, job market improvements, and targeted policy efforts aimed at inclusive banking. Conversely, recent increases in unbanked households suggest that economic disruptions—like rising inflation and higher living costs—are critical barriers, emphasizing the vulnerability of financial inclusion gains.
Policy Recommendations and Future Directions
To maintain and expand recent progress, Philadelphia and peer cities can consider prioritizing the following strategies:
- Enhanced Data Collection and Transparency: Comprehensive racial, age, and income-level data collection is essential for precisely identifying gaps and tailoring interventions.
- Inclusive Financial Education Programs: Expand culturally sensitive and targeted financial education, specifically tailored for underserved and minority populations, to build financial literacy and confidence in banking systems.
- Offering more agile, flexible bank account offerings to help enhance access to banking services: Offering easier access to banking services would reduce barriers to entry, and allow for a higher proportion of the vulnerable segment to access financial services.
Conclusion
Philadelphia’s trajectory of financial inclusion between 2015 and 2023 underscores significant potential for urban communities to achieve higher levels of economic resilience. While overall improvements are commendable, persistent disparities and recent economic vulnerabilities highlight critical areas requiring continued focus and innovative policy solutions. Through enhanced data transparency, targeted financial literacy efforts, and strengthened community collaboration, Philadelphia can sustain and deepen its gains, potentially becoming a national model for comprehensive financial inclusion.
References
Built In. (2025). Top Philadelphia, PA Financial Services Companies 2025. Retrieved from https://builtin.com/companies/location/philadelphia/type/financial-services-companies
DiStefano, J. N. (2024, December 27). Pa. hasn’t gotten any new banks in over a decade. Here’s why. The Philadelphia Inquirer. Retrieved from https://www.inquirer.com/business/banking-growth-regulations-competition-20241227.html
Federal Reserve Board. (2014). Where Are All the New Banks? The Role of Regulatory Burden in New Bank Formation. Retrieved from https://www.federalreserve.gov/econresdata/feds/2014/files/2014113pap.pdf
Hometown Banker. (2023). Hyperion Bank – Bringing “Community Banking” Back to Philadelphia Communities. Retrieved from http://www.hometownbanker.org/hyperion-bank-bringing-community-banking-back-to-philadelphia-communities/
Investopedia. (2024). Savings and Loan Crisis (S&L): What Happened and Aftermath. Retrieved from https://www.investopedia.com/terms/s/sl-crisis.asp
Wikipedia. (2024). Savings and Loan Association. Retrieved from https://en.wikipedia.org/wiki/Savings_and_loan_association
Billy Penn. (2022). Philly is poised to become the first U.S. city to run its own bank. Retrieved from https://billypenn.com/2022/02/18/philadelphia-municipal-public-bank-financial-authority-derek-green/
Resilience.org. (2023). Philadelphia Passes Public Banking Law. Retrieved from https://www.resilience.org/stories/2023-03-09/philadelphia-passes-public-banking-law/
PhillyVoice. (2022). Philadelphia takes initial step towards creating nation’s first municipal public bank. Retrieved from https://www.phillyvoice.com/philadelphia-public-financial-authority-municipal-bank-city-council-derek-green/
Axios Philadelphia. (2022, March 7). Philadelphia closer to creating public bank. Retrieved from https://www.axios.com/local/philadelphia/2022/03/07/philadelphia-closer-creating-public-bank
PPFA Board Application Information. (n.d.). Philadelphia Public Financial Authority Overview. Retrieved from https://phlcouncil.com/ppfa