Philadelphia’s Economic Competitiveness – PART 3: City to City Employment and Wages
In this Leading Indicator, we continue our series exploring the economic competitiveness of Philadelphia across measures of employment and business growth. In the previous two issues, we compared employment and business growth metrics for the City of Philadelphia with its neighboring suburban counties and found that the city saw the largest growth in private employment during the last ten years. In addition, the analysis showed that Philadelphia’s business environment during this period could be characterized as more robust than its suburban counties, with the city seeing the highest overall growth in private business establishments. While a few suburban counties did outpace the city on pay and large employer growth, the baseline analysis demonstrated that the City of Philadelphia remains the economic engine of the metropolitan region.
For the remaining pieces of this series, we expand our baseline analysis to compare Philadelphia’s economic competitiveness with other major U.S. cities. Philadelphia is often characterized as “the poorest big city” in the U.S. [1], leading to expectations that it would perform poorly against other cities across metrics of employment, wage, and business growth. While this notorious distinction has been attributed to a range of social, economic, and political factors, including the city's current tax structure, limited public transportation access and investment , underfunded public education, fragmented and misaligned workforce development opportunities, and an enduring legacy of structural racism, we position the remainder of this series to expand our baseline comparison of Philadelphia’s economic competitiveness with the intention of further testing the impact of these factors. To start these peer city comparisons, we first analyze private sector employment and wage growth estimates for both the City of Philadelphia and the top 15 core cities of the largest metropolitan regions in the United States.
Key Takeaways
- As of 2019, Philadelphia had the second smallest absolute private employment count among the core cities of the 15 largest U.S. metropolitan regions, surpassing only Washington D.C.
- In 2019, Philadelphia’s ratio of working age residents (16- to 64-years-old) per private sector job was 1.8 – meaning there almost two working age Philadelphians for every job opportunity in the city – the highest ratio among peer cities.
- Between 2010 and 2019, Philadelphia had the lowest employment growth among peer cities, and grew slower than the national average.
- Philadelphia’s average annual growth rate of private employment from 2010 to 2019 was 1.5 percent, making it the second lowest growth rate among the 15 peer cities – only surpassing Chicago.
- When accounting for the concentration of employment in core cities as a share of each metropolitan region’s entire employment, Philadelphia had the third lowest concentration among peer cities in 2019, at 24 percent; only Washington D.C. and Boston had lower concentrations.
- While the nominal wages in Philadelphia still rank in the bottom third of the 15 peer cities, the growth in private wages in Philadelphia has seen a consistent uptick during the decade before the COVID-19 pandemic.
- In 2019, Philadelphia’s average annual wage of $68,691 was not only higher than the four peer cities of Los Angeles, Detroit, Phoenix and Miami, but also greater than the national average of $59,202.
- Between 2010 and 2019, average private sector wages in Philadelphia increased by 7.4 percent, outpacing wage growth in New York City, Washington D.C., Phoenix, Los Angeles and Houston during the same period.
- At 0.8 percent, Philadelphia’s average annual growth rate for private sector wages from 2010 to 2019 placed it in the top third of the 15 major U.S. cities. This growth rate translates to an average increase of approximately $535 in pay per year, accounting for inflation.
- In 2019, Philadelphia’s average wage was roughly $4,446 greater than the average wage of its entire metropolitan region – surpassing major cities like Chicago, Houston, Detroit, Miami, Phoenix, and Los Angeles.
Private Sector Employment Growth
Philadelphia performs poorly on private sector employment compared to its peer cities. Figure 1 details the raw count of private sector employment, the labor force participation rate for working age residents (16- to 64-years-old), and a ratio of working age residents (16- to 64-years-old) per private sector job in the 15 core cities of the largest U.S. metropolitan regions in 2019. As shown in Figure 1, Philadelphia has the second smallest private employment estimate among the 15 cities, surpassing only Washington D.C. Since these are raw numbers of private sector employment, they are moderately correlated with overall population counts.
Labor force participation and the number of working age residents per private sector job reaffirm Philadelphia’s relatively poorer performance on private sector employment compared to its peer cities. At 70 percent, Philadelphia has the second lowest labor force participation rate among the 15 cities in 2019, besting Detroit by just 0.1 percent, and it ranks the lowest of the cities in terms of the ratio of working age persons for every private employment opportunity, at 1.8. In an ideal case, a city with major job centers and private employers would also host higher quantity (and quality) of employment opportunities for their working age residents; a 1.0 ratio would indicate that there is one private employment opportunity available for every working-age resident. While a few other major cities also fare poorly on this measure, Philadelphia has almost two working age residents for every private sector employment opportunity available. Philadelphia’s economic competitiveness lags its peers in terms of quality employment opportunities.
FIGURE 1
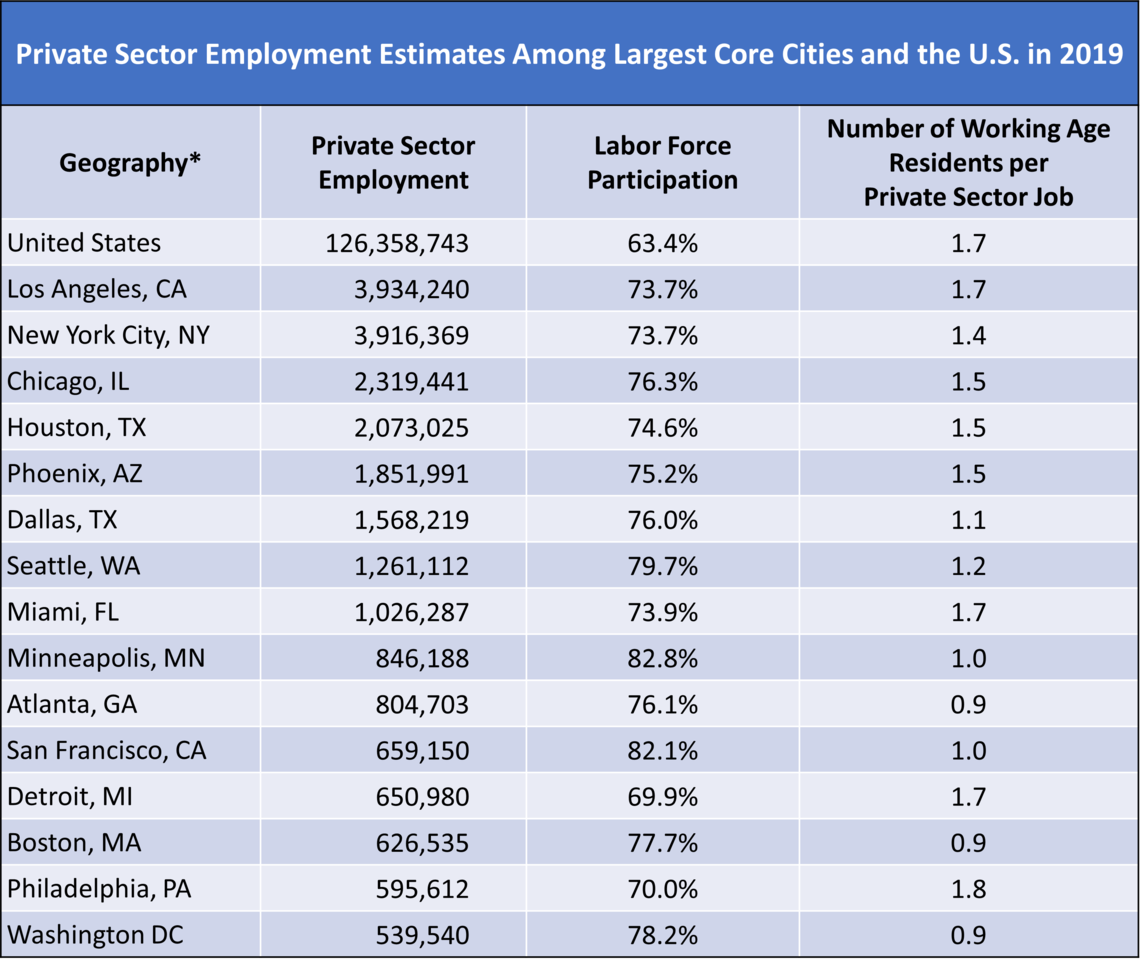
SOURCE: U.S. Bureau of Labor Statistics’ 2019 Quarterly Census of Employment and Wages and five-year estimates of the U.S. Census Bureau’s 2019 American Community Survey. The Riverside–San Bernardino–Ontario metropolitan area of southern California was excluded from this analysis for its lack of robust central city-to-county economic estimates that skewed interpretation.
NOTE: * estimates reflect each city’s corresponding county employment estimates (or counties for New York City)
Philadelphia has also not fared well in terms of growth in private sector jobs during the ten years preceding the COVID-19 pandemic. Figure 2 shows indexed private sector employment growth in Philadelphia, its peer cities, and the U.S. from 2010 to 2019. As shown in Figure 2, Philadelphia has had the lowest job growth among its peer cities over the ten-year period and falls below the national average. Generally, cities in the West Coast and the South have outperformed cities in the East Coast and Rust Belt. In fact, Chicago, Minneapolis, and Detroit are in the same range as Philadelphia during this ten-year period. Several West Coast cities, including Seattle and San Francisco, as well as the Southern cities like Dallas and Houston have shown much stronger employment growth. Despite the comparatively low rate of employment growth in Philadelphia, it has been consistently rising and grew by 12.5 percentage points in 2019 from its lowest point in 2013, overtaking Chicago’s rate of job growth in 2018. This points to healthy economic conditions for U.S. cities and the nation overall, which has benefitted Philadelphia but at a slower rate compared to peers. Philadelphia remains a “slow-growth” economy [2].

FIGURE 2
SOURCE: U.S. Bureau of Labor Statistics’ 2010 through 2019 Quarterly Census of Employment and Wages
Figure 3 further illustrates Philadelphia’s slow private job growth by detailing the average annual growth rate of private sector employment between 2010 and 2019 across the 15 cities and the U.S. as a whole. Once again, Philadelphia ranks near the bottom with an annual average growth rate of 1.5 percent – translating to the addition of roughly 8,300 jobs per year between 2010 and 2019. In fact, by raw employment counts, Philadelphia saw the lowest absolute average annual job growth among the 15 cities. Even Minneapolis, with a population only a quarter of the size of Philadelphia’s total population, saw roughly 14,000 jobs added per year between 2010 and 2019 – 1.7 times the rate of Philadelphia’s average annual employment growth.
FIGURE 3
SOURCE: U.S. Bureau of Labor Statistics’ 2010 through 2019 Quarterly Census of Employment and Wages
Recognizing Philadelphia’s role as the economic engine of its metropolitan region, figure 4 details each core city’s concentration of employment as a share of its total metropolitan region’s employment. As figure 4 shows, 24 percent of the total labor force in the Philadelphia metropolitan region was employed within the City of Philadelphia in 2019. As with other measures of employment, Philadelphia trails its peers, except for Washington D.C. and Boston, in its city employment concentration. Generally, Northeastern U.S. cities tend to have much lower job concentration in the core city compared to their counterparts on the West Coast and Mid-West – which tends to reflect the sprawling nature of Western and Southern core cities. However, the average employment concentration within the core city of Philadelphia has increased at a rate of 0.24 percent from 2010 to 2019, which is higher than many cities with higher overall employment concentrations in 2019. This hints at the prospect of Philadelphia drawing in more employment to the city than the suburbs – supporting our previous finding from the first piece of this series.
FIGURE 4
SOURCE: U.S. Bureau of Labor Statistics’ 2010 through 2019 Quarterly Census of Employment and Wages
Private Sector Wage Growth
Private sector wage growth presents a more promising story for Philadelphia compared to the other 15 peer cities in our analysis. While the nominal wages in Philadelphia still rank in the bottom third of the peer cities, the growth in private wages in Philadelphia has seen a consistent uptick during the ten years preceding the pandemic. Figure 5 details the average annual wages of core cities within the 15 largest U.S. metropolitan regions in 2019. Philadelphia’s annual wage of $68,691 was not only higher than the four peer cities of Los Angeles, Detroit, Phoenix and Miami, but was also higher than the national average of $59,202.
FIGURE 5
SOURCE: U.S. Bureau of Labor Statistics’ 2019 Quarterly Census of Employment and Wages
The promising wage growth story is further confirmed when looking at wage growth from 2010 to 2019. Figure 6 depicts indexed private sector wage growth (in 2020 dollars) for Philadelphia, the 15 peer cities, and the U.S. from 2010 to 2019. Philadelphia has a similar growth trend in private wages as most of its peer cities during this ten-year period, excluding the outliers of San Francisco and Seattle, when accounting for inflation. During this ten-year period, private wages in Philadelphia increased by 7.4 percent from 2010 to 2019, outpacing the wage growth in New York City, Washington D.C., Phoenix, Los Angeles, and Houston. The recent boom in tech jobs explains the massive growth in private wages for these West Coast cities, whereas more mature economies on the East Coast tend to have modest growth in wages over time [3].
FIGURE 6
SOURCE: U.S. Bureau of Labor Statistics’ 2010 through 2019 Quarterly Census of Employment and Wages
In fact, the average annual growth rate of private sector wages puts Philadelphia in the top third of major U.S. cities. Figure 7 shows the difference in private sector wage growth between Philadelphia and its peer cities by comparing average annual growth rates from 2010 to 2019. At 0.8 percent, Philadelphia’s average annual growth rate for private sector wages translated to an average annual increase of approximately $535, accounting for inflation. This places it in the middle of the 15 peer cities in terms of absolute average annual wage growth and far above cities like New York City and Los Angeles. Philadelphia’s higher average annual growth rate may also reflect its relatively low starting wage in 2010, but the decade of growth closely tracked that of most cities in our analysis. This supports the notion that Philadelphia is keeping on par with peer cities in terms of pay, and that the city is more competitive when it comes to paying employees a comparable wage to what is offered in other cities.
FIGURE 7
SOURCE: U.S. Bureau of Labor Statistics’ 2010 through 2019 Quarterly Census of Employment and Wages
In addition to the overall growth in private wages, we also analyzed the difference in wages between these core cities and their metropolitan regions in 2019 – depicted in figure 8. This difference in average wages illustrates the role of each core city as the economic engine of their respective metropolitan regions and reflects the city residents’ wealth in comparison with their suburban counterparts. Cities like San Francisco, Boston, and Atlanta have large differences in wages between the core city and the suburbs, with wealth concentrated in the core city and poverty in the surrounding municipalities. On the other hand, areas like Los Angeles, Phoenix, Miami, and Detroit have wealth concentrated in the suburbs and more poverty in the city. Philadelphia falls in the middle with a difference of $4,446 between the city’s and surrounding metropolitan region’s average wages in 2019 – demonstrating the divergent concentrations of both wealth and poverty throughout the city and the suburbs. Wages in Philadelphia are only slightly higher than its surrounding suburbs compared to other major U.S. metropolitan regions.
FIGURE 8
SOURCE: U.S. Bureau of Labor Statistics’ 2010 through 2019 Quarterly Census of Employment and Wages
Looking Forward
The measures on employment and wages suggests that Philadelphia offers fewer employment opportunities compared to its peer city counterparts. Yet wage growth in Philadelphia has seen a promising upward trend, before the COVID-19 pandemic, and could continue down that path in the post-pandemic recovery. Given this baseline comparison of economic competitiveness, it is imperative to understand the reasons why Philadelphia trails behind its peer cities. Before diving into these reasons, our next piece in the series will continue to establish a baseline on business growth between the City of Philadelphia and the top 15 core cities of the largest metropolitan regions in the United States to see how Philadelphia fares in retaining, developing, and attracting new businesses.
Works Cited
[1] Center City District. 2017. “Philadelphia: An Incomplete Revival.” Center City Reports, 30 January. Retrieved from: (https://centercityphila.org/uploads/attachments/ciyfyq8sr0mqsvlqdj6x1a8b3-ccr17-incompleterevival.pdf)
[2] Center City District. 2019. “Growing More Family Sustaining Jobs in Philadelphia.” Center City Reports. 30 October. (https://centercityphila.org/uploads/attachments/ck24wk9av08l08lqdv2nmwekd-19-jobs-report-web-update.pdf)
[3] Berube, Alan and Murray, Cecile. 2018. “Renewing America’s Economic Promise Through Older Industrial Cities.” Brookings Institute. April. (https://www.brookings.edu/research/older-industrial-cities/#01073)