Philadelphia’s Economic Competitiveness – PART 1: City and Suburban Employment and Wages
Author’s Note:
With ongoing debates about altering the city’s tax structure, the dominant narrative is that the City of Philadelphia is less economically competitive than other areas. Using updated numbers from the U.S. Bureau of Labor Statistics and other administrative data resources, we begin a series analyzing Philadelphia’s economic competitiveness across business development metrics.
As we shift modes from pandemic response to recovery, the dominant narrative among many city officials and civic leaders is that the city’s tax and regulatory structures make Philadelphia less competitive than its surrounding suburbs. The City of Philadelphia derives most of its tax revenue from relatively volatile business activity taxes, such the residential and commuter wage taxes and business income and receipts (BIRT), rather than more stable revenue sources – like property taxes. This system, enacted in the late 1930s, helped the city climb out of the Great Depression and lessened the blow of the Great Recession [1]; its limitations were made apparent during the massive disruption in business activity caused by the COVID-19 pandemic.
With the announcement of a very large federal stimulus package being made available to bolster the city’s revenue [2], many civic and business leaders see this as an opportune moment to debate the city’s reliance on business taxes. A key part of the prevailing narrative is that the city’s business taxes privilege business growth in the surrounding suburban counties [3]. To test this hypothesis, we analyze and compare private sector employment and wage growth estimates for both the City of Philadelphia and the surrounding ten counties that make up the metropolitan statistical area (see Figure 1).
FIGURE 1
SOURCE: The Philadelphia Metropolitan Region (or Greater Philadelphia) as defined by the U.S. Office of Management and Budget (OMB) and the U.S. Census Bureau.
Key Takeaways
- With just under 600,000 private sector jobs in 2019, the City of Philadelphia serves as the major job center for the metropolitan region. The city accounts for 24 percent of the region’s private sector employment, 1.3 times more than Montgomery County - the county with the second largest private sector employment count.
- Private sector employment in Philadelphia and the surrounding suburban counties has been steadily growing between 2010 and 2019, with the city slightly outpacing the suburbs from 2016 to 2019.
- While Philadelphia saw the third highest annual average growth rate for private sector employment in the region, at 1.5 percent between 2010 and 2019, this percentage translates to an absolute average increase of roughly 8,300 private jobs per year; far outpacing all other counties in the region.
- Chester and Montgomery Counties recorded the highest annual average private sector wages in the region in 2019 at $73,541 and $72,199, respectively; Philadelphia followed third at $68,691.
- Philadelphia has seen far greater growth in private sector wages than the surrounding suburban counties with a 7.4 percent increase in its average annual private sector wage from 2010 to 2019 - only 1.1 percent behind the national average, when accounting for inflation.
- Between 2010 and 2019, the average annual private sector wage of the suburban counties decreased by 13.4 percent, when accounting for inflation.
- At 0.8 percent, Philadelphia saw the highest annual average growth rate in private sector wages in the region between 2010 and 2019; translating to roughly an annual increase of $535, when accounting for inflation.
Private Sector Employment Growth
The City of Philadelphia anchors private sector employment activity in the larger metropolitan region. Figure 2 details the raw count of private sector jobs, labor force participation rate for residents 16 years and older, and a normalized count of working age residents (16- to 64-years-old) per private sector job in the City of Philadelphia, the surrounding suburban counties, and the U.S. in 2019. With just under 600,000 private sector jobs in 2019, the City of Philadelphia serves as the major job center for the metropolitan region. It accounts for 24 percent of the region’s total private employment and hosted 1.3 times as many private sector jobs as Montgomery County – the county with the second largest private employment count in 2019.
FIGURE 2
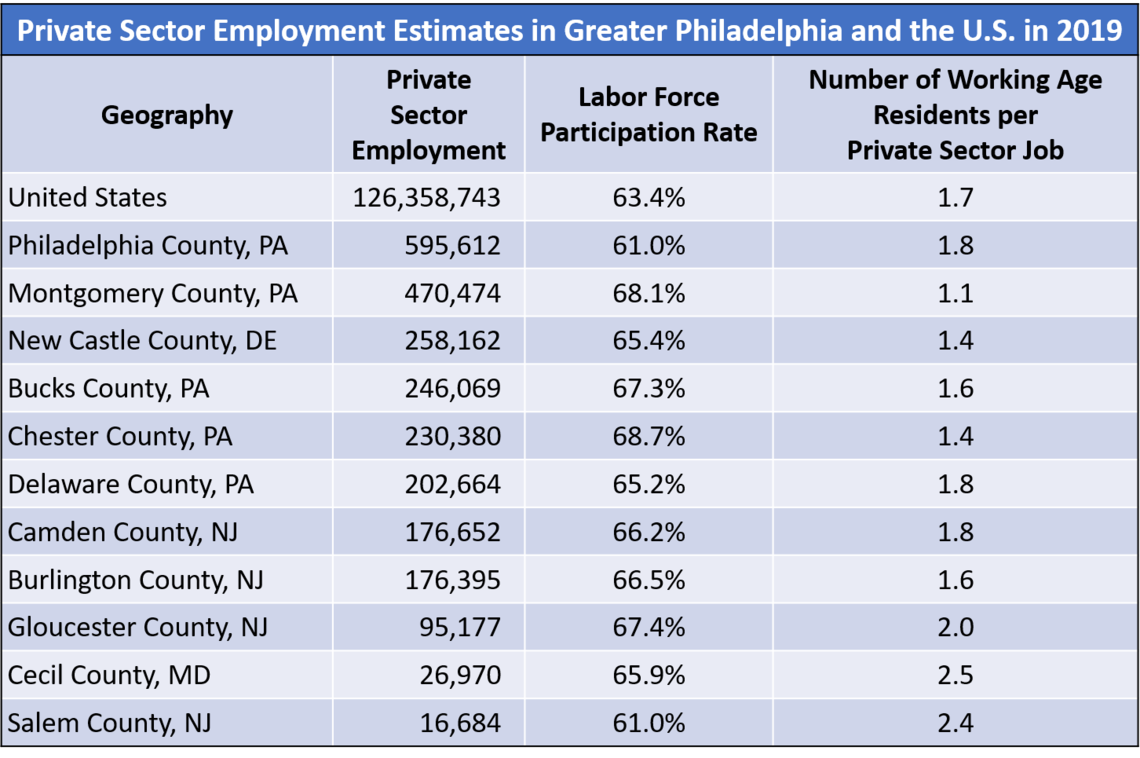
SOURCE: U.S. Bureau of Labor Statistics’ 2019 Quarterly Census of Employment and Wages and five-year estimates of the U.S. Census Bureau’s 2019 American Community Survey.
In measures of labor force participation and the proportion of working age residents per private employment opportunity, the city seems to fare worse than the surrounding suburbs. At 61 percent in 2019, the city’s labor force participation rate for residents 16 years and older was tied with Salem County as the lowest in the region, 2.4 percent lower than the national average and 7.7 percent lower than Chester County, the county with the highest rate. In 2019, the city also had 1.8 working age persons for every private employment opportunity, slightly worse than the U.S. average of 1.7 but much worse than Montgomery County’s 1.1 ratio. In an ideal case, a county with major job centers and private employers would also host higher quantity (and quality) of employment opportunities for their working age residents; a 1.0 ratio would indicate that there is one private employment opportunity available for every working-age resident.
Philadelphia is also growing slightly more private sector jobs than the surrounding suburbs, though less than the national average. Figure 3 details indexed private sector job growth in the city, the suburbs, and the U.S. from 2010 to 2019. Overall, private sector jobs grew steadily both in the city and the suburbs with the city slightly outpacing the suburbs from 2016 to 2019; both trailed the national average, however, by roughly five percent. By 2019, private employment in Philadelphia was 14.4 percent greater than it had been in 2010; the city also outpaced average suburban private employment levels in 2019 by 3.1 percent.
FIGURE 3
SOURCE: U.S. Bureau of Labor Statistics’ 2010 through 2019 Quarterly Census of Employment and Wages
Figure 4 depicts the average annual growth rate of private sector jobs between 2010 and 2019 for each county in Greater Philadelphia along with the U.S. as a whole. Cecil and Gloucester Counties far outpaced the U.S. and Philadelphia with their average annual growth rates of 2.3 and 2.0 percent, respectively. Considering their low levels of private employment, however, this translates to the addition of roughly 500 to 1,900 private sector jobs per year. Philadelphia saw the third greatest growth rate in the region at 1.5 percent, trailing the national average growth rate by a half percent, but this percentage translates to the addition of roughly 8,300 private sector jobs per year between 2010 and 2019 – far outpacing all other counties in the region.
FIGURE 4
SOURCE: U.S. Bureau of Labor Statistics’ 2010 through 2019 Quarterly Census of Employment and Wages
In terms of private employment growth, Philadelphia has maintained a slight edge over the suburban counties. This largely reflects the higher concentration of businesses which offer a wide array of employment opportunities that eclipse the local suburbs. It should be noted, however, that these raw growth estimates do not account for the quality of private sector jobs being created (a subject we have written about, at length).
Private Sector Wage Growth
Prior to the COVID-19 pandemic, only two suburban counties had higher average wages than Philadelphia. Figure 5 shows the average annual private sector wages for Greater Philadelphia and the U.S. in 2019. Chester and Montgomery Counties recorded the highest annual average private sector wages in the region in 2019 at $73,541 and $72,199, respectively. Philadelphia followed at $68,691, roughly $5,000 less than the average private sector wages of Chester and Montgomery Counties. The city’s average annual private sector wage, however, far outpaced the national average, by roughly $9,500. These higher wages reflect the caliber of businesses and employment opportunities offered in these areas. Chester and Montogomery Counties host office parks, in places like King of Prussia, that cater to multinational corporations that offer more specialized-skill employment with higher wages. Philadelphia also hosts a wide array of similar multinational businesses and employment opportunities but also a greater proportion of low-wage private employment because of the higher concentration of service-sector businesses - especially in the very large healthcare support, retail, and hospitality sectors [4]. The wealthier suburbs have much smaller proportions of low-wage private employment since the service sector jobs are far less numerous and concentrated.
FIGURE 5
SOURCE: U.S. Bureau of Labor Statistics’ 2019 Quarterly Census of Employment and Wages
While the city has a smaller average private sector wage than some suburban counties, it has seen far greater growth in wages than its surrounding suburbs. Figure 6 depicts indexed private sector wage growth (in 2020 dollars) for the City of Philadelphia, the surrounding suburban counties, and the U.S. from 2010 to 2019. Philadelphia’s private sector wage growth largely mirrored national trends, with a slightly larger difference in growth between 2016 and 2018. In fact, by 2019, Philadelphia’s average annual private sector wage was 7.4 percent greater than its value in 2010 and only 1.1 percent less than the national average. The average private sector wage of the suburban counties, on the other hand, steadily declined from 2010 to 2019. By 2019, the average annual private sector wage of the suburban counties was 20.8 percent less than that of Philadelphia and 13.4 percent less than the average annual suburban private sector wage in 2010, when accounting for inflation.
FIGURE 6
SOURCE: U.S. Bureau of Labor Statistics’ 2010 through 2019 Quarterly Census of Employment and Wages
Figure 7 further details the difference in private sector wage growth between Philadelphia and its suburban counties by comparing growth rates from 2010 to 2019. Philadelphia saw an annual average growth rate of 0.8 percent in private sector wages, translating to roughly an annual increase of $535.00, when accounting for inflation. The city only trailed the national average by 0.1 percent but exceeded Cecil County’s average annual growth rate, the next highest, by 0.4 percent. In fact, the city far outpaced the growth rates of all the suburban counties.
FIGURE 7
SOURCE: U.S. Bureau of Labor Statistics’ 2010 through 2019 Quarterly Census of Employment and Wages
Thus, as with measures of employment growth, private sector wage growth in Philadelphia exceeded that of suburbs.
Looking Forward
These measures of private employment and wage growth suggest that, despite the current tax structure, the city remains slightly more competitive for private sector workers than the surrounding suburbs. This is not to say that the city’s competitiveness could not increase with tax policy changes, but that the narrative of the suburbs’ superior competitiveness for private employment and wage growth is not exhibited in these data. For our next piece in this series, we will compare business growth to see how the city compares with the suburbs in retaining, developing, and attracting new businesses.
Works Cited
[1] McCrystal, Laura. 2019. “Philly’s wage tax is the highest in the nation. Here’s everything you need to know about it.” The Philadelphia Inquirer, 15 May. Retrieved from: (https://www.inquirer.com/news/wage-tax-rate-philadelphia-business-jobs-reduction-reform-20190515.html).
[2] Briggs, Ryan. 2021. “Philly pols eye wage and business tax cuts ahead of next city budget.” PlanPhilly, 7 April. Retrieved from: (https://whyy.org/articles/philly-pols-eye-wage-and-business-tax-cuts-ahead-of-next-city-budget/).
[3] McCrystal, Laura. 2021. “Some suburban commuters might not return to Philly. City Council is skeptical of giving them a tax cut.” The Philadelphia Inquirer, 4 May. Retrieved from: (https://www.inquirer.com/politics/philadelphia/philadelphia-wage-business-tax-cuts-kenney-city-council-20210504.html).
[4] The Economy League of Greater Philadelphia. 2017. Industry Analytics for the City of Philadelphia’s Workforce Strategy. Philadelphia, PA: The Economy League of Greater Philadelphia. Retrieved from: (https://economyleague.org/driving-regional-change/campaigns-projects/industry-analytics).