Living Wage Employment in Greater Philadelphia
With debates raging about labor shortages and quality jobs, both in our region and across the country, we turn our sights on this issue by examining the growth of jobs above and below Greater Philadelphia’s living wage. In 2020, this figure—which is based on the minimum level of income an individual needs to afford the basics in our region—was $14.47 an hour [1].
Key Takeaways
- Greater Philadelphia is relatively more affordable than peer metropolitan regions with a living wage of $14.47 in 2020 - the third lowest among the 15 largest U.S. metropolitan areas.
- At 73.6 percent, Greater Philadelphia had the second highest proportion of employment in occupations that paid above the region’s living wage in 2019 – only Greater Detroit saw a higher proportion at 75.3 percent.
- Prior to the COVID-19 pandemic, Greater Philadelphia saw significantly higher growth in below living wage occupations than its peer metropolitan areas - 1.5 times the average rate of the 14 largest U.S. metropolitan areas.
- Growth in employment in occupations that paid above the region’s living wage trailed the average growth of peer metropolitan areas from 2012 to 2019 by 2 percent.
- The onset of the COVID-19 pandemic saw Greater Philadelphia’s previous growth in below living wage occupations severely decline by 20 percent; for comparison, the 14 largest U.S. metropolitan areas saw an average decline of 17.5 percent during the same period.
- Above living wage employment was more resilient to the impact of the COVID-19 economic crisis, with a 3 percent decline in Greater Philadelphia and a 0.1 percent average increase for peer metropolitan regions.
- If Greater Philadelphia’s economic recovery still prioritizes the growth of below living wage employment (as it had prior to the pandemic), our region will face an affordability crisis with more workers finding themselves pushed in or towards poverty.
A Living Wage
Debates persist over the best way to measure a livable wage - or a wage that allows an individual to afford a geographically specific standard of living [1]. Federal guidelines, like poverty thresholds and the minimum wage, have traditionally served as the core benchmarks that drive labor and housing policy, despite persistent criticism that they fail to capture the lived experiences of low-income people living in certain areas of the country – particularly urban areas [2]. The Living Wage Calculator, an innovative measure developed by Dr. Amy Glasmeier at MIT, overcomes many of the deficiencies of federal metrics by including geographically specific costs related to food, childcare, health insurance, housing, transportation, and other necessities (e.g., clothing, personal care items, etc.) [1].
Figure 1 details the living wage of the 15 largest U.S. metropolitan areas in 2020 while figure 2 shows the distribution of employment above and below each area’s living wage using median wage estimates from the U.S. Bureau of Labor Statistics’ Occupational Employment Statistics program.
FIGURE 1
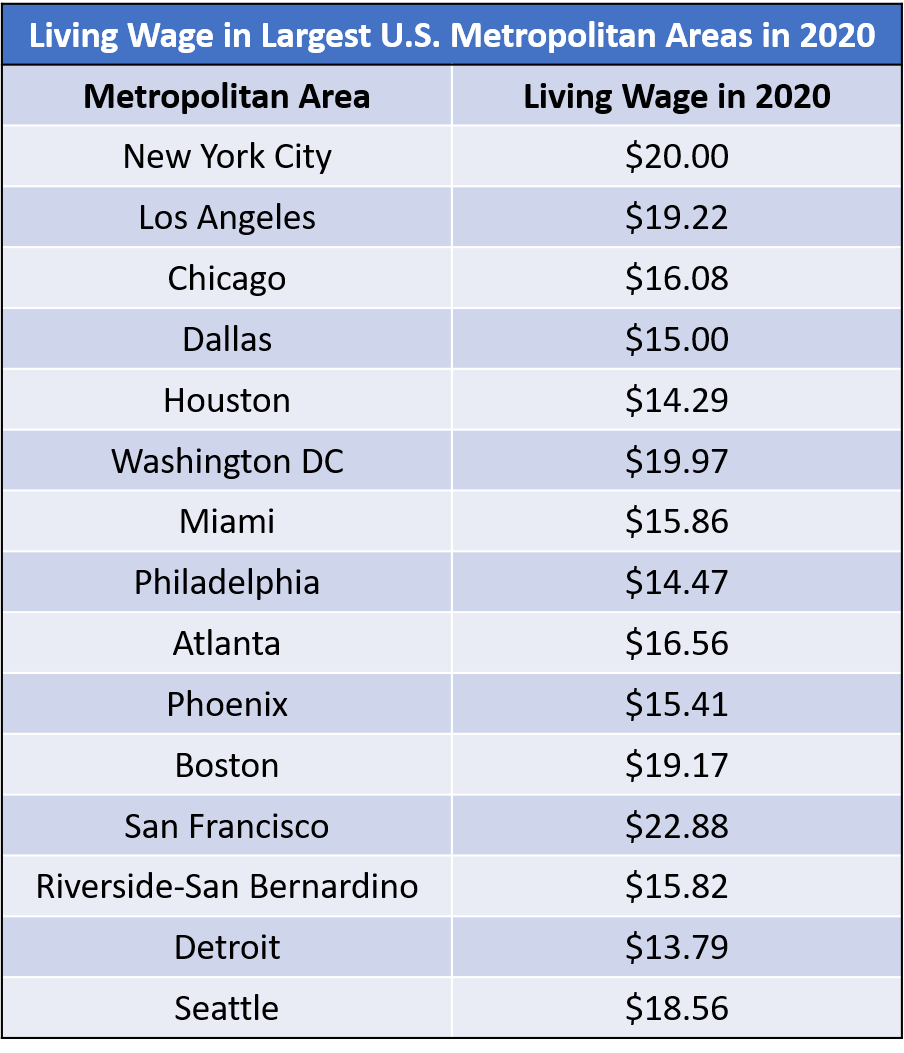
SOURCE: Living Wage Calculator
FIGURE 2
SOURCE: Living Wage Calculator and U.S. Bureau of Labor Statistics’ 2019 Occupational Employment Statistics program estimates
NOTE: Displaying 2019 estimates since 2020 estimates were impacted by the COVID-19 pandemic. The Living Wage Calculator estimates from 2019 were adjusted from 2020 dollars. Also, some occupational categories from the Occupational Employment Statistics program do not detail annual or hourly wage estimates, thus the total employment percentages exclude these occupations and do not equal exactly 100 percent.
Greater Philadelphia’s living wage was $14.47 in 2020, the third lowest among the 15 largest U.S. metropolitan areas. Only Detroit and Houston had lower wages commensurate with their more affordable standards of living. Greater San Francisco boasts the highest living wage and is followed closely by New York City and Washington DC – regions known for their high costs of living and competitive housing markets. While Greater Philadelphia’s 2020 living wage aligns with national progressive campaigns for a $15 federal minimum wage, there is great variation in cost-of-living across the country and this figure would fall short in many large metropolitan regions.
Figure 2 illustrates Greater Philadelphia’s relative affordable cost of living in comparison with the 14 other largest U.S. metropolitan areas. Prior to the COVID-19 pandemic, Greater Philadelphia had the second lowest proportion of employment in occupations with a median wage below the region’s living wage of $14.29, 1.5 percent higher than Greater Detroit. Metropolitan areas with more expensive costs of living, like New York City, San Francisco, Washington DC, and Boston, had far higher proportions of their workforces in occupations with median wages below their respective living wages. Greater Los Angeles topped the list, with 46 percent of its employment in occupations with median wages below that region’s living wage, 1.8 times greater than Greater Philadelphia.
The Growth of Sub-Living Wage Employment
Figure 3 compares the growth of Greater Philadelphia’s living wage employment with the averages of the other 14 largest U.S. metropolitan areas.
FIGURE 3
SOURCE: Living Wage Calculator and U.S. Bureau of Labor Statistics’ 2012 through 2020 Occupational Employment Statistics program estimates.
While figures 1 and 2 illustrated Greater Philadelphia’s relative affordability in comparison to other major metropolitan areas, figure 3 demonstrates how much of the region’s recent employment growth has come from occupations with a median wage below that of the region’s living wage. Between 2012 and 2019, Greater Philadelphia’s sub-living wage employment grew by an annual average rate of 2.4 percent while the above-living wage employment only grew by 0.9 percent. For the 14 largest U.S. metropolitan areas (excluding Greater Philadelphia), the average annual growth rate of sub-living wage employment from 2012 to 2019 was 1.6 percent while above-living wage employment grew by 2.9 percent. Thus, Greater Philadelphia’s sub-living wage employment grew at 1.5 times the rate of the 14 largest U.S. metropolitan areas while its annual growth rate for above-living wage employment trailed by 2 percent.
Greater reliance on low-wage, foundational-skill employment makes a metro more susceptible to economic tremors and recessions. This is evident in figure 3, where the impact of the COVID-19 pandemic on employment can be seen from 2019 to 2020. Sub-living wage employment plummeted by almost 20 percent in Greater Philadelphia and 17.5 percent across the 14 largest U.S. metropolitan areas. Since there were no commensurate gains in above-living wage employment, these declines show the dramatic impact of layoffs and furloughs in the wake of the pandemic. Above-living wage employment, on the other hand, declined in Greater Philadelphia by 3 percent and increased among the 14 largest U.S. metropolitan regions by 0.1 percent. Above-living wage employment is more resilient in the face of economic shocks like the COVID-19 pandemic and must thus be a key component to Greater Philadelphia’s economic recovery.
A Labor Shortage or Reassessment of Basic Needs
With continued debates about “labor shortage” consuming commentators across the nation, we can offer insight on the great realignment occurring in the U.S. labor force. Many low-wage employment opportunities are remaining unfilled as businesses reopen during the pandemic’s current downward trend [3]. While some economists and investors argue that workers are still waiting to be vaccinated or prioritizing childcare before the return to work, growing qualitative evidence points towards a reassessment of basic needs for employees [4]. Many previously laid off and furloughed workers see the vulnerability of their previous employment options and have used their stimulus and extra time to pursue new career building opportunities [5]. Also, most unemployment benefits have been more lucrative and financially stable than those of low- or minimum wage employment [6]. Ongoing open low-wage employment opportunities will need to become more innovative to compete for workers who are beginning to reassess the livability of federal minimum wage employment – a measure that has not changed for over a decade. Wage increases, better benefits, childcare, and other basic need options may be innovative methods for businesses to compete for labor [3,4].
This brief also demonstrates the need for Greater Philadelphia to address its quality of employment growth to better address its economic competitiveness and resiliency. The region is in desperate need of more public-private partnerships with policymakers and business leaders focusing on paying livable wages, invest in workforce development and upskilling their workforce, improving underfunded local school systems, growing diverse businesses, and attracting new businesses that offer more career-building opportunities rather than low-wage jobs. The continued growth in occupations paying below the region’s living wage will push more residents toward poverty since potential inflation will only push the region’s cost of living up. Unless systemic changes can be made, Greater Philadelphia may be facing a looming affordability crisis.
Works Cited
[1] Nadeau, Carey Anne. 2021. Living Wage Calculator: User’s Guide/Technical Notes. Cambridge MA: Massachusetts Institute of Technology, Department of Urban Studies and Planning. Retrieved from: https://livingwage.mit.edu/pages/about
[2] Ravenscraft, Eric. 2019. “What a ‘Living Wage’ Actually Means.” The New York Times, 5 June. Retrieved from: (https://www.nytimes.com/2019/06/05/smarter-living/what-a-living-wage-actually-means.html).
[3] Leonhardt, David. 2021. “The Myth of Labor Shortages.” 20 May. Retrieved from: (https://www.nytimes.com/2021/05/20/briefing/labor-shortages-covid-wages.html).
[4] Long, Heather. 2021. “It’s not a ‘labor shortage.’ It’s a great reassessment of work in America.” The Washington Post, 7 May. Retrieved from: (https://www.washingtonpost.com/business/2021/05/07/jobs-report-labor-shortage-analysis/).
[5] Parker, Kim, Ruth Igielinik, and Rakesh Kochhar. 2021. “Unemployed Americans are feeling the emotional strain of job loss; most have considered changing occupations.” Pew Research Center, 10 February. Retrieved from: (https://www.pewresearch.org/fact-tank/2021/02/10/unemployed-americans-are-feeling-the-emotional-strain-of-job-loss-most-have-considered-changing-occupations/).
[6] Wolf, Zachzry B. 2021. “Here's the truth about the labor shortage.” CNN Politics, 22 May. Retrieved from: (https://www.cnn.com/2021/05/22/politics/what-matters-labor-shortage/index.html).