Philadelphia’s Economic Competitiveness – PART 2: City and Suburban Business Growth
We continue our series on Philadelphia’s economic competitiveness by comparing the growth of private businesses in the city and surrounding suburban counties. As discussed in the first issue of this series, the debate around Philadelphia’s poverty, business vitality, and employment opportunities often centers on the premise that the city’s current tax structure has given the suburbs a competitive advantage for attracting and retaining employers and new businesses. In this issue, we analyze private sector net establishment growth across the eleven counties of Greater Philadelphia.
Key Takeaways
- Philadelphia is home to the largest number of private establishments among the metropolitan area’s eleven counties, accounting for 22.4 percent of all private businesses in the region in 2018.
- The majority of regional businesses are located in the suburban counties, averaging roughly 466,863 establishments in 2018 to Philadelphia’s 134,537 establishments or a ratio of 3.5 suburban businesses for every Philadelphia-based business.
- With six years of uninterrupted growth from 2012 to 2018, the number of private businesses in Philadelphia in 2018 was almost 30 percent greater than it had been in 2012 – more than twice the rate of business growth nationally and nearly three times the average growth of the suburban counties.
- Philadelphia's private establishments grew at a rate of 4.3 percent annually from 2012 to 2018, almost twice the national average and 1.7 times greater than New Castle County, the county with the second highest growth rate in the region and the only county in the region, other than Philadelphia, to exceed the national growth rate.
- Philadelphia is home to the highest concentration of both small and large businesses. In 2018, it accounted for 22.4 percent of all establishments with 99 employees or less and 28 percent of all establishments with 500 employees or more in the region.
- Montgomery County was the only suburban county in 2018 to surpass the city’s concentration of medium-sized establishments (100 to 499 employees), with 21.4 percent of such business versus the city’s 20.7 percent.
- Philadelphia surpassed both national and suburban growth rates for small businesses (those with fewer than 100 employees) from 2012 to 2018.
- Philadelphia trailed both national and suburban growth rates for mid-size business between 2012 and 2018.
- Both the city and suburbs trailed the national average growth rate of large businesses from 2015 to 2018. The city began to close the gap with the national growth rate from 2015 to 2018 while the suburban counties only saw more significant growth in large establishments between 2017 and 2018.
- Philadelphia led the region in small private establishment growth from 2012 to 2018 with an annual average growth rate of 4.4 percent – translating to roughly 5,000 new small businesses per year.
- Philadelphia lagged the national growth rate for mid-size establishments, while Montgomery, Delaware, and Gloucester Counties outpaced the national growth rate in this category.
- The city’s average annual growth rate for large employer establishments, at 2.5 percent, tracked very close to the national average, while Gloucester, Burlington, and Camden saw exceptional growth in large establishments from 2012 to 2018 with growth rates of 13.8, 5.4, and 5.3 percent, respectively.
Overall Business Growth
Figure 1 shows the total number of private establishments in Greater Philadelphia and the U.S. in 2018. In absolute terms, Philadelphia is home to the largest number of establishments among the metropolitan area’s eleven counties, accounting for 22.4 percent of all private businesses in the region. The other 77.6 percent of regional businesses are located in the suburban counties, roughly 466,863 establishments in 2018, a ratio of 3.5 suburban businesses for every Philadelphia-based business. Montgomery County stands out as having a high count of businesses in comparison to its population density. Even with its more sprawling population, the county has only a third less businesses than Philadelphia.
FIGURE 1
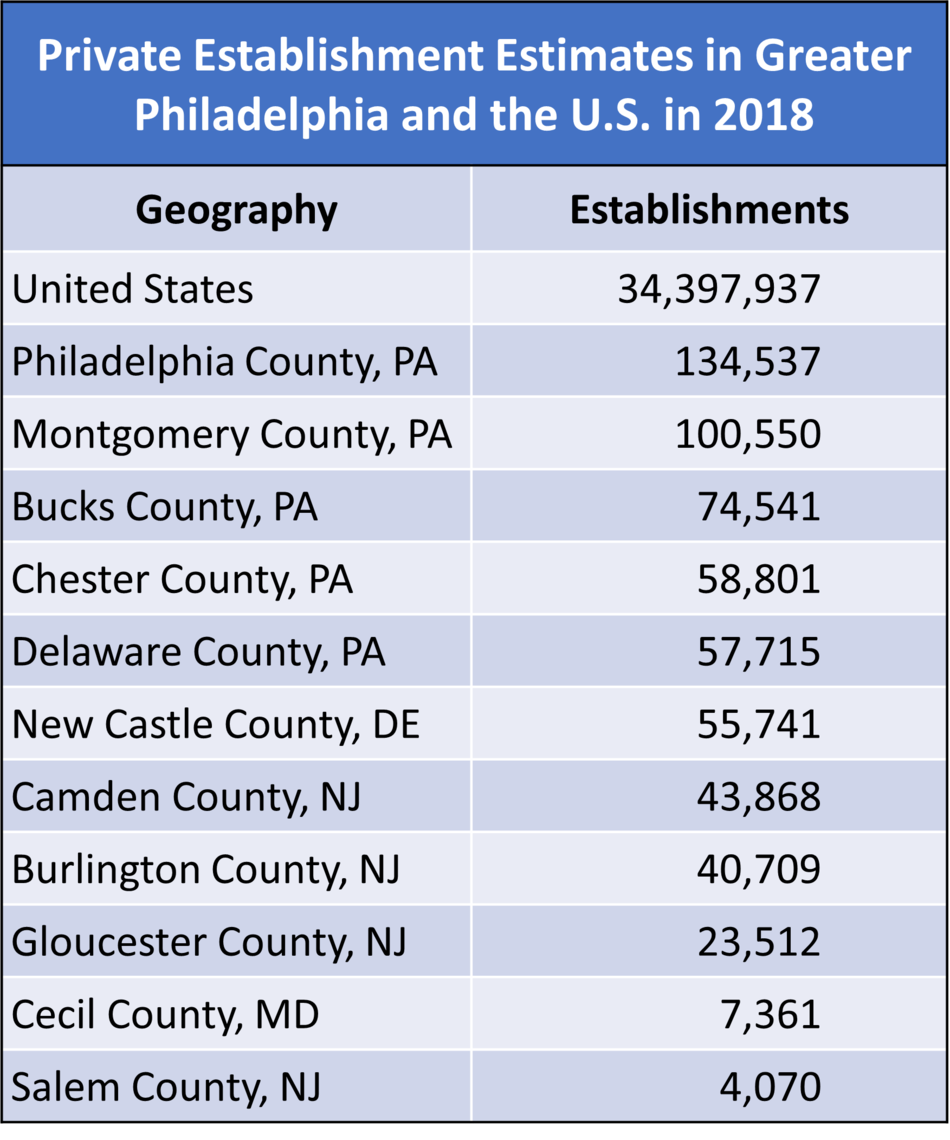
SOURCE: U.S. Census Bureau’s 2018 County Business Pattern estimates combined with 2018 Non-Employer Statistics estimates (the most recently available estimates). Only establishments that could be attributed to an employment size category were included in the analysis.
Figure 2 further details the concentration of businesses in the region by normalizing establishment counts per square mile. By simple density, Philadelphia is the engine of business activity in the region with roughly 1,003 private establishments per square mile in 2018, 3.2 times greater than Delaware County – the county with the second highest business density – and 100.3 times greater than the national business density. It should be noted that this measure does not account for business clustering in districts and calculates a density assuming that all businesses were even distributed across an area. That is why more urban and suburban counties have such higher business densities than more rural counties or areas with large amounts of open land.
FIGURE 2
SOURCE: U.S. Census Bureau’s 2018 County Business Pattern estimates combined with 2018 Non-Employer Statistics estimates (the most recently available estimates). Only establishments that could be attributed to an employment size category were included in the analysis. Area estimates were obtained from U.S. Census Bureau’s County Estimates.
The city has also seen significantly more growth in private establishments than the suburbs. Figure 3 shows the indexed growth of private establishments for Philadelphia, its suburban counties, and the nation from 2012 to 2018, while figure 4 details the average annual growth rates of each county over the same period. With six years of uninterrupted growth, the number of businesses in Philadelphia in 2018 was almost 30 percent greater than it had been in 2012 – more than twice the business growth of the national average and nearly three times that of the suburban counties. Its annual average growth rate of 4.3 percent was also almost twice that of the national average and 1.7 times greater than New Castle County – the second highest county and the only suburban county in the metropolitan region to exceed the national average.
FIGURE 3
SOURCE: U.S. Census Bureau’s 2012 through 2018 County Business Pattern estimates combined with 2012 through 2018 Non-Employer Statistics estimates (the most recently available estimates). Only establishments that could be attributed to an employment size category were included in the analysis.
FIGURE 4
SOURCE: U.S. Census Bureau’s 2012 through 2018 County Business Pattern estimates combined with 2012 through 2018 Non-Employer Statistics estimates (the most recently available estimates). Only establishments that could be attributed to an employment size category were included in the analysis.
Business Growth by Employer Size
While general business growth can shed some light on economic competitiveness, disaggregating by business size can determine how well an area is attracting major employers as well as the vitality of its start-up and small business ecosystem. While large businesses provide a significant share of tax revenue and employment opportunities for residents, midsize and small businesses are key to understanding the health of a local economy by reflecting the range of services available to residents and larger businesses, the ease of starting a business in that ecosystem, and the potential for innovation [1]. Smaller firms can also provide a larger share of tax revenue relative to the proportion of the total workforce they employ [1].
Figure 5 details the share of small, medium, and large private employer establishments in Greater Philadelphia and the U.S. Using Pew’s previous categorization of small and midsize businesses, we define large establishments as those with 500 or more employees, medium establishments as those with 100 to 499 employees, and small establishments as those with 0 to 99 since they include non-employer or self-owned businesses. Across each geography, the distribution of large, medium, and small private establishments is roughly the same with small and non-employer establishments comprising roughly 99 percent of each area’s business ecosystem, medium establishments comprising roughly half a percent, and large establishments barely surpassing one one-hundredth of a percent.
FIGURE 5
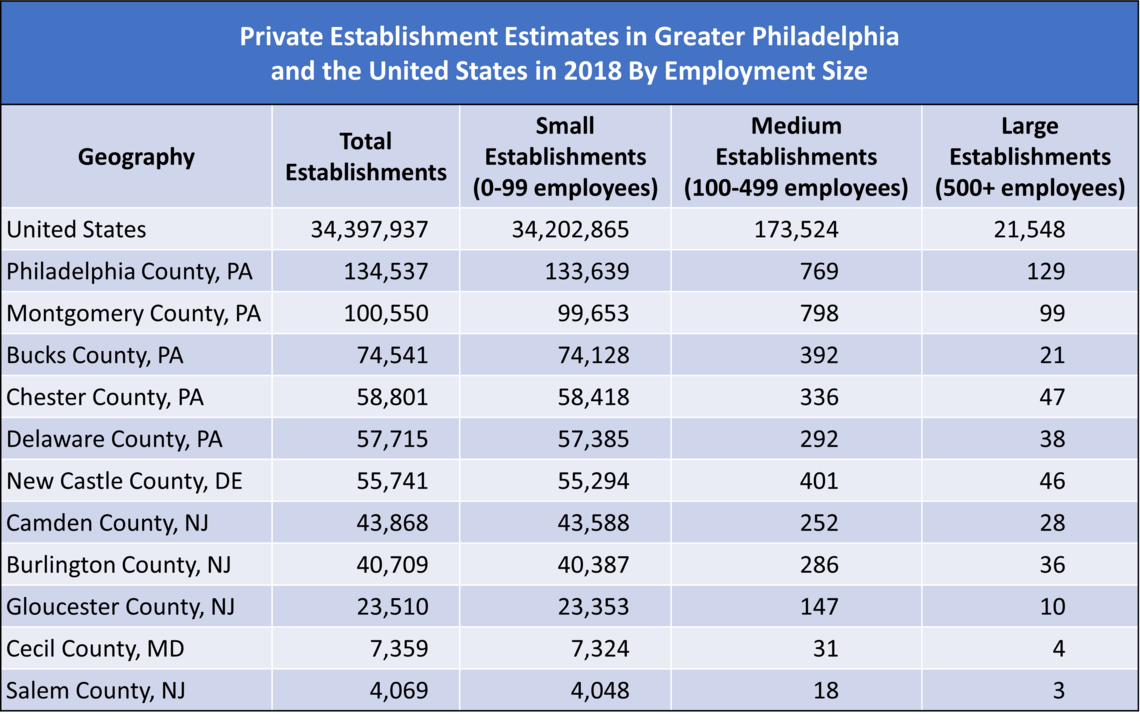
SOURCE: U.S. Census Bureau’s 2018 County Business Pattern estimates combined with 2018 Non-Employer Statistics estimates (the most recently available estimates). Only establishments that could be attributed to an employment size category were included in the analysis.
The City of Philadelphia eclipses every other county in concentration of small and large businesses. In 2018, it accounted for 22.4 percent of all small and non-employer establishments and 28 percent of all large employer establishments. Montgomery County surpasses the city in its concentration of medium-sized employers, at 21.4 percent to the city’s 20.7 percent. The concentration of businesses in the suburban counties eclipsed Philadelphia in 2018 – with 3.5 suburban small establishments for every small establishment in the city, 3.8 for medium establishments, and 2.6 for large establishments.
Figure 6 details the indexed growth of each type of private employer establishment in Philadelphia, along with the average growth in the suburban counties and the U.S. from 2012 to 2018. Given the considerable concentration of small and non-employer establishments in the region, it is no surprise that the small establishments’ indexed growth trend resembles the overall establishment growth trend in figure 3. Small businesses are the main driver behind Philadelphia’s business growth and a leading reason that it outpaces the surrounding suburbs and the national average. As in Figure 3, the number of small and non-employer businesses in Philadelphia in 2018 was almost 30 percent greater than it had been in 2012 and more than double the growth in the nation and the suburban counties. In medium establishment growth, Philadelphia trailed both the nation and the surrounding suburbs with a 2018 business count only six percent greater than it had been in 2012, after a few years of decline; both the nation and the suburban counties saw consistent average growth in medium-sized establishments during the whole period with the suburbs only trailing the national average growth rate by less than one percent. In large establishment growth, both the city and suburbs have trailed the national average growth rate since 2015. The city, however, has seen an uptick in large establishment growth since 2015 while the suburban counties have only seen more significant growth between 2017 and 2018.
FIGURE 6
SOURCE: U.S. Census Bureau’s 2012 through 2018 County Business Pattern estimates combined with 2012 through 2018 Non-Employer Statistics estimates (the most recently available estimates). Only establishments that could be attributed to an employment size category were included in the analysis.
Finally, Figure 7 shows the average annual growth rate of private establishments by employment size in Greater Philadelphia and the U.S. from 2012 to 2018. As in Figure 6, figure 7 shows that Philadelphia led in small establishment growth from 2012 to 2018 with an annual average growth rate of 4.4 percent - roughly translating to an addition of 5,000 small or non-employer establishments per year. Besides Philadelphia, only New Castle County - home to the regional banking capital in Wilmington - surpassed the national average annual growth rate of small establishments at 2.2 percent.
FIGURE 7
SOURCE: U.S. Census Bureau’s 2012 through 2018 County Business Pattern estimates combined with 2012 through 2018 Non-Employer Statistics estimates (the most recently available estimates). Only establishments that could be attributed to an employment size category were included in the analysis.
In terms of the average growth of medium and large-sized businesses, Philadelphia trails its suburban counties. In both instances, the city is below the national average with an annual average growth rate of 1.1 percent for medium-sized establishments and 2.5 percent for large establishments. For medium establishment growth, Montgomery, Delaware, and Gloucester Counties outpaced the national average growth rate by 1.4, 0.6, and 0.5 percent, respectively. The gap in large establishment growth rates between Philadelphia and the national average, however, is much smaller. The city’s growth rate of 2.5 percent trails the national growth rate by just 0.2 percent but translates to an average addition of roughly three large employer establishments per year between 2012 and 2018. The suburban counties of Gloucester, Burlington, and Camden, however, saw exceptional growth in large establishments from 2012 to 2018 with growth rates of 13.8, 5.4, and 5.3 percent, respectively. Some of this growth may be linked to aggressive business development and restructured tax policies that have attracted distribution centers and support services to these areas [2,3,4]. Camden, in particular, has seen success in attracting large employers into the county and the city with revised tax structures and generous incentives – some of which have drawn criticism from local leaders who argue that Camden residents have seen scant benefit via employment opportunities [5,6].
Businesses in the City and its Suburbs
Overall, the data examined thus far suggest that Philadelphia is reasonably competitive with its suburbs. Philadelphia remains the economic engine of the region and saw significant business growth prior to the COVID-19 pandemic. There is undoubtedly room for improvement. Much of the city’s business and employment growth has come from small and non-employer businesses often offering relatively low wages and weak career-sustaining employment opportunities [7,8,9]; some suburban counties outperform the city in metrics of business growth or average annual pay, as detailed in the previous issue in this series. Research suggests that access to talent is perhaps the most important factor in business location decisions, and the city’s reputation for subpar talent development systems is a major weakness [10,11].
The Next Comparison
In the next issues of this series, we move beyond the city-suburb dynamic and take a closer look at the employment and business growth of Philadelphia’s peer U.S. cities to better understand the factors behind economic growth and competitiveness.
Works Cited
[1] The Pew Charitable Trusts. 2020. Philadelphia’s Small and Midsize Business Landscape:
A look at the city’s smaller companies and how they compare with those elsewhere. Philadelphia, PA: The Pew Charitable Trusts. Retrieved from: (https://www.pewtrusts.org/en/research-and-analysis/reports/2020/08/philadelphias-small-and-midsize-business-landscape).
[2] Hengel, Amanda Hamm. 2018. “Industry Expansion.” SouthJersey.com, 30 August. Retrieved from: (https://www.southjersey.com/article/35363/Industry-Expansion).
[3] Reitmeyer, John. 2018. “New Jersey thinks now might be the time to raise corporate taxes.” WHYY, 8 March. Retrieved from: (https://whyy.org/segments/new-jersey-thinks-now-might-time-raise-corporate-taxes/).
[4] Blumenthal, Jeff. 2017. “Amazon to open 1M-square-foot warehouse in South Jersey.” Philadelphia Business Journal, 24 April. Retrieved from: (https://www.bizjournals.com/philadelphia/news/2017/04/24/amazon-to-open-1m-square-foot-warehouse-in-south.html).
[5] Laday, Jason. 2014. “Philadelphia 76ers CEO: Camden practice facility will be 'biggest and best' in U.S.” NJ.com, 10 June. Retrieved from: (https://www.nj.com/camden/2014/06/philadelphia_76ers_ceo_camden_practice_facility_will_be_biggest_and_best_in_us.html).
[6] DiUlio, Nick. 2020. “Behind the Camden Comeback.” New Jersey Monthly, 16 November. Retrieved from: (https://njmonthly.com/articles/jersey-living/camden-comeback/).
[7] Shields, Michael. 2019. “Why Haven’t Philly Wages Increased with Employment Levels? (Part 1).” Economy League, 11 December. Retrieved from: (https://economyleague.org/providing-insight/leadingindicators/2019/12/11/employwagespart1).
[8] Shields, Michael. 2020. “Why Haven't Philly Wages Increased with Employment Levels (Part 2).” Economy League, 3 February. Retrieved from: (https://economyleague.org/providing-insight/leadingindicators/2020/02/03/employwagespart2).
[9] Shields, Michael. 2020. “The Economic Impact of COVID-19: Philadelphia’s Working Poor and ‘On-The-Edge’ Populations.” Economy League, 25 March. Retrieved from: (https://economyleague.org/providing-insight/leadingindicators/2020/03/25/covid-poor).
[10] Parilla, Joseph and Sifan Liu. 2019. Talent-Driven Economic Development: A new vision and agenda for regional and state economies. Washington D.C: Brookings Institution. Retrieved from: (https://www.brookings.edu/wp-content/uploads/2019/10/2019.10.15_Brookings-Metro_Talent-driven-economic-development_Parilla-Liu.pdf).
[11] Parilla, Joseph. 2019. “Talent is precious. That’s why economic development should focus on developing it.” Better Cities Project, 11 December. Retrieved from: (https://better-cities.org/economic-prosperity/talent-is-precious-thats-why-economic-development-should-focus-on-developing-it/).