Why Haven't Philly Wages Increased with Employment Levels (Part 2)
In the last issue of Leading Indicators, we showed that Philadelphia’s wage growth has lagged employment levels in recent years. We hypothesized as to why this lag persists: much of the city’s recent employment growth stems from increases in foundational-skill-level jobs with lower wages. In this brief, we put our hypothesis to the test by diving into the city’s employment growth across industries. We then identify the fastest growing industries and unpack the characteristics of their fastest growing occupations.
The Key Takeaways:
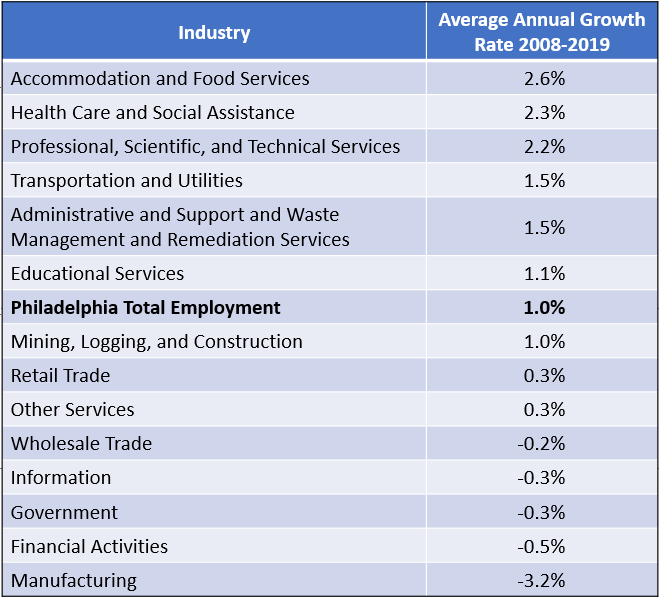
- Philadelphia saw an average annual growth in employment by 1.0% from 2008 to 2019.
- The Accommodation and Food Services industry saw the largest increase in employment since 2008 (33.1%) and the highest average annual growth rate (2.6%) of any industry
- Among the city’s fastest growing industries, lower wage occupations accounted for almost 80% of the employment added among the top ten fastest growing occupations.
- There are signs that Philadelphia is increasing employment among higher-paying occupations in the Professional, Scientific, and Technical Services industry

Which Industries are Seeing Employment Growth?
As we noted in our previous data brief, Philadelphia saw strong job growth following the Great Recession of 2007-2009. Most of those gains, however, were concentrated among only a few industries. Figure 1 shows the growth in Philadelphia’s employment across industries from 2008 to 2019 (indexed to 2008), while Table 1 details each industry’s average annual growth rate during the same time period.
FIGURE 1:

TABLE 1:
NOTE: Data for FIGURE 1 and TABLE 1 were obtained from the U.S. Bureau of Labor Statistics' Current Employment Statistics (CES) estimates for the City of Philadelphia. While the CES produces detailed estimates for various higher-level industries it is not comprehensive. Certain industries, like the "Arts, Entertainment, and Recreation" industry, are often nested in higher-level industries that were not used in this analysis.
Overall, the city saw average annual employment growth of 1.0 percent from 2008 to 2019, driven primarily by the service sector. Topping this list was Accommodation and Food Services industry, which saw the largest increase in employment during this period—33.1 percent—and the highest average annual growth rate—2.6 percent. This category—which includes restaurants, eateries, and hotels across the city—accounts for 8.5 percent of the city’s total employment in 2019. These dramatic increases in employment since 2008 support the anecdotal accounts of Philadelphia’s vibrant food and hospitality scene that has piqued national interest.
The only other industries to see consistent employment growth in the city since 2008 are the Health Care and Social Assistance (2.3%), Transportation and Utilities (1.5%), and Educational Services (1.1%) industries. Of these, the Health Care and Social Assistance industry had the fastest growth rate and largest overall increase in employment—28.5 percent. This is unsurprising considering the large and growing concentration of health systems, hospitals, and care and assistance facilities in Philadelphia.
Other categories to see growth include the Professional, Scientific, and Technical Services (2.2%), Administrative and Support and Waste Management and Remediation Services (1.5%), Mining, Logging, and Construction (1.0%), Retail Trade (0.3%), and Other Services (0.3%) industries. While some of the growth in these industries is market-driven, a portion of the growth reflects collaboration between anchor institutions and private investors working to nurture new industries in the city. Growth in the Professional, Scientific, and Technical Services industry, for example, demonstrates the local investment community’s continued commitment to attracting more innovative and technologically focused businesses from the city’s local universities. The data supports the mounting anecdotal evidence detailing the growth of local cutting-edge industries - like biotech.
Does the Money Match the Growth?
Figure 1 detailed the breakdown of industries contributing to the city’s overall growth in employment. As we noted in our previous data brief, however, wage growth hasn’t tracked employment growth. We identified the fastest growing occupations from industries with an average annual growth rate greater than the city’s (see Table 1). Table 2 shows the city’s top ten fastest growing occupations from 2008 to 2018 and pay differentials versus the city’s overall average annual wage in 2018: $64,989.
TABLE 2:
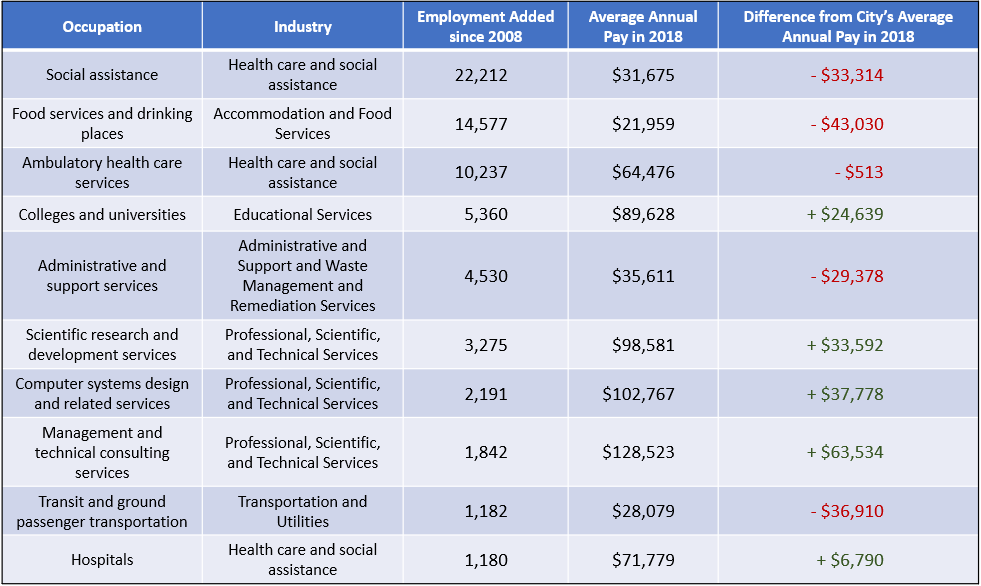
NOTE: Data for TABLE 2 were obtained from the U.S. Bureau of Labor Statistics' Quarterly Census of Employment and Wages (QCEW) estimates for the City of Philadelphia. Occupations listed in TABLE 2 represent three-digit NAICS codes.
At first glance, it seems as though about half of the fastest growing occupations are above the average and half below. Yet when accounting for the sample’s total number of jobs added since 2008, a staggering 80 percent of employment added has an average annual pay substantially below the city’s average. This supports the hypothesis that the lag in wage growth reflects the types of jobs being added.
Consistent with the findings of the Economy League’s 2017 industry analysis, most of the fastest growing occupations within Table 2 come from industries that primarily generate low-wage and part-time work. Many Social Assistance occupations—like childcare workers or personal and home care aids—and Food Services and Drinking Places occupations—like fast food servers, wait staff, and cooks—often don’t have stable hours or consistent pay.
However, there are signs that employment across higher-paying sectors like the Professional, Scientific, and Technical Services industry may be on the rise. Table 2 shows a high concentration of specific-skill and specialized occupations added since 2008. The series of occupations that focus on innovation, technology, and research within the Professional, Scientific, and Technical Services category (along with the Colleges and Universities occupation category) account for almost 20 percent of employment added since 2008. Some of this growth can be traced back to the commitment of local anchor institutions and private investors working to transfer innovative ideas and technologies out of university labs and into private industry.
Resiliency Threats
In sum, most of Philadelphia’s recent employment growth comes from growth in sectors that generate primarily foundational-skill, low-wage jobs. While some job growth is always better than none, it is worth monitoring to see if the trend toward adding almost exclusively low wage jobs persists. Such a heavy concentration of job growth at the low end makes the city less competitive and less economically resilient. If the city were to experience another recession (a topic we previously covered), low-wage occupations are usually the first to be eliminated, which puts a disproportionate segment of the workforce at risk of unemployment. It would behoove city government, major anchor institutions, and private-sector employers to work together to promote shared solutions that help bring balance to the city’s labor market.