Greater Philadelphia’s Tech Workforce: The 2022 Data Update
As illustrated by our Driving Tech Talent Growth in PHL report, its 2019 update, and our annual monitoring of the regional tech workforce, the Economy League of Greater Philadelphia has consistently demonstrated that the region’s technology sector offers unique possibilities to build new equitable employment and business opportunities in our region. This Leading Indicator is the fourth in our series of data briefs monitoring Greater Philadelphia’s tech workforce to better understand its recent trajectory.
What You Need to Know
- As of 2022, Greater Philadelphia regained roughly 2,500 tech jobs since 2021 and stands at roughly 103,220 total core tech jobs.
- Greater Philadelphia’s tech employment saw relatively consistent growth from 2012 to 2019. By 2020, regional tech employment remained stable at around 110,000 jobs, but declined by approximately 10,000 jobs in 2021.
- Accounting for just below 4% of the region’s total occupation count, the concentration of tech occupations—or the total regional proportion of tech occupations—in Greater Philadelphia in 2022 has remained below the average concentration among 20 peer U.S. metropolitan regions for the past decade.
- The average concentration of tech occupations for peer U.S. metropolitan regions stands at 4.9% as of 2022 – 1.2% greater than the concentration of tech occupations in Greater Philadelphia.
- Of the 21 peer U.S. metropolitan regions, Greater Philadelphia saw the fourteenth largest concentration of tech occupations in 2022 at 3.7%.
- Greater Philadelphia’s 2.5% growth in tech occupations from 2021 to 2022 was the third lowest growth rate out of the 21 peer U.S. metropolitan regions.
Greater Philadelphia’s Tech Workforce
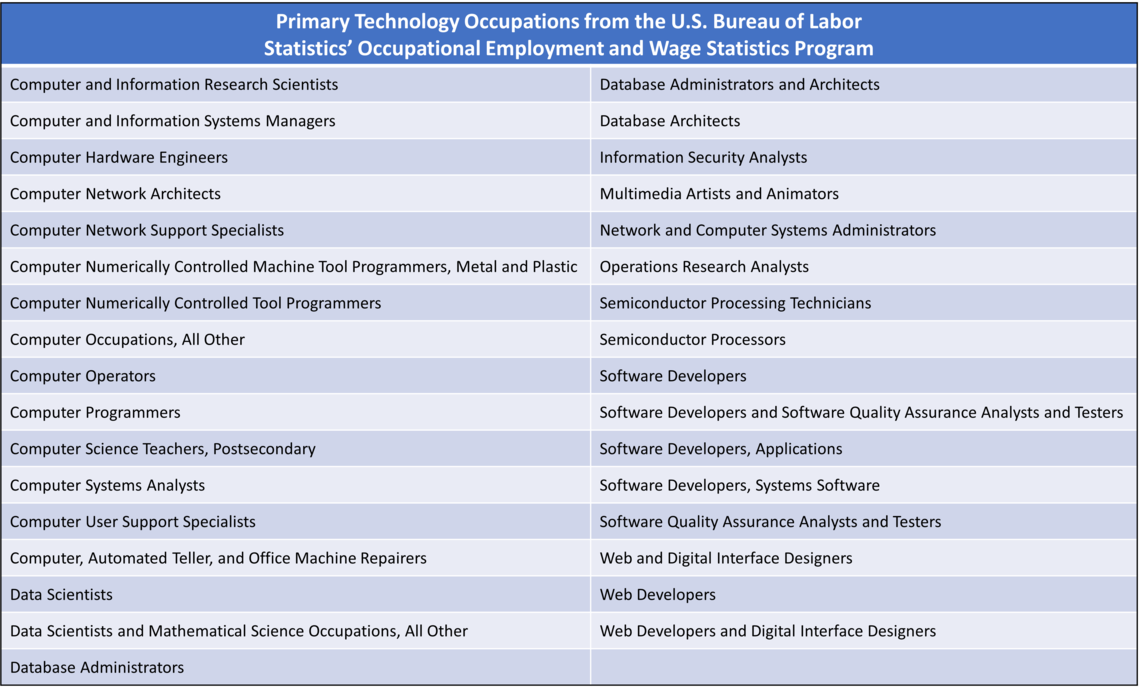
Measuring the “technology sector” is challenging since “tech” occupations are found across multiple industries. It is not uncommon for medical insurers to employ data analysts or financial firms to employ software developers. While some studies try to measure tech employment by aggregating various industries and estimating proportions of tech employment, we have chosen to directly aggregate various tech occupations to capture the unique size and shape of Greater Philadelphia’s tech workforce. This allows for a more accurate count of tech occupations since many industry estimates will include a variety of non-tech occupations in their counts. For example, industry-level estimates for tech employment may include administrative staff, building security, or staff accountants in their estimates. Our analysis only incorporates “primary tech occupations” or those general tech occupations that could be found across multiple industries, like data analysts, software developers, programmers, etc. Therefore, our analysis excludes various field-specific tech occupations (e.g., health technologists or technicians, biomedical engineers, electronics engineers, etc.) so that we can better monitor the region’s core and transferable tech occupations without diving to deeply into the state of other “tech-adjacent” regional industries, like healthcare or finance. Thus, our method of focusing on the core of the region’s tech occupations may be more conservative than other tech workforce estimates. A full list of tech occupations used in this brief is detailed in Appendix A.

FIGURE 1
SOURCE: Data were obtained from annual estimates of the 2012 through 2022 U.S. Bureau of Labor Statistics’ Occupational Employment Statistics (OES) program.
Greater Philadelphia’s tech employment saw relatively consistent growth from 2012 to 2019. By 2020, regional tech employment remained stable around 110,000 jobs, but declined by approximately 10,000 jobs in 2021. The stability of the tech workforce at the onset of the COVID-19 pandemic reflects its overall necessity during the initial economic lockdowns and stay-at-home mandates. As many office functions shifted to remote settings, increasingly reliant on technology platforms like Microsoft Teams or Zoom, tech workers became even more essential to the new environment. The exact reason behind the 2021 decline in tech jobs is still somewhat unclear, but many theories link this contraction to the later pandemic-era trend of workers changing occupations and retiring, also known as the “Great Resignation.” Along with the healthcare industry, tech saw some of the highest quit and turnover rates as the labor market grew more competitive from 2020 to 2021 [1]. These jobs saw a steep increase in demand at the onset of the pandemic, likely leading to increased workloads and burnout and pushing many workers to reconsider the field [1]. As of 2022, Greater Philadelphia had regained roughly 2,500 tech jobs lost since 2021, and total regional tech employment stands at roughly 103,220.
Metropolitan Tech Concentrations
Compared to peer U.S. metropolitan regions, the concentration of tech workers in Greater Philadelphia remains slightly below average. Figure 2 depicts the concentration of Greater Philadelphia’s tech occupations as a share of the region’s total occupations from 2012 to 2022. It also compares Greater Philadelphia’s tech concentration with the average concentration among 20 peer U.S. metropolitan regions.
FIGURE 2
SOURCE: Data were obtained from annual estimates of the 2012 through 2022 U.S. Bureau of Labor Statistics’ Occupational Employment Statistics (OES) program.
As in Figure 1, Figure 2 demonstrates that the concentration of tech occupations in Greater Philadelphia grew from 2012 to 2019, then sharply increased in 2020 and declined in both 2021 and 2022. Accounting for just under 4% of the region’s total occupation count, the concentration of tech occupations in Greater Philadelphia in 2022 remained below the average concentration of 20 peer U.S. metropolitan regions for the past decade. The average concentration of tech occupations across peer U.S. metropolitan regions grew from 4.3% to 4.6% between 2012 and 2019 but, unlike Greater Philadelphia, continued to grow in 2021 and 2022. The average concentration of tech occupations for peer U.S. metropolitan regions now stands at 4.9% as of 2022 – 1.2% greater than the concentration of tech occupations in Greater Philadelphia.
Occupational concentrations can be influenced both by internal employment changes (i.e., changes to the region’s tech occupations) as well as external employment changes (i.e., changes to the region’s total occupations). This was the case in 2020, when both Greater Philadelphia’s tech workforce as well as the metropolitan average saw substantial increases. Rather than raw employment increases, however, this increase in the concentration reflects large losses in the region’s total employment – that is, the contraction of the denominator of total occupations. While tech jobs largely remained stable in Greater Philadelphia (see Figure 1), many other occupations faced lay-offs and furloughs in the early months of the COVID-19 pandemic. This also illustrates why Greater Philadelphia added roughly 2,500 core tech jobs between 2021 and 2022, yet the region’s concentration of tech occupations declined. It likely reflects the build back of non-tech occupations that were lost in the early months of the pandemic. The growth of these other non-tech occupations outpaced the growth of tech occupations during the same period.
By disaggregating tech occupation concentrations across major U.S. metropolitan regions, we can compare Greater Philadelphia’s tech workforce with its peers. Figure 3 compares Greater Philadelphia’s concentration of tech occupations with those of its 20 peer U.S. metropolitan regions.
FIGURE 3
SOURCE: Data were obtained from annual estimates of the 2012 through 2022 U.S. Bureau of Labor Statistics’ Occupational Employment Statistics (OES) program.
Of the 21 large U.S. metropolitan regions, in 2022 Greater Philadelphia ranked fourteenth in its concentration of tech occupations at 3.7%. Unsurprisingly, major tech hubs, like Greater San Jose, Greater Seattle, Greater Washington D.C., and Greater San Francisco, topped the list in 2022. Greater San Jose, the home to Silicon Valley, outpaces all other metropolitan regions with 16.7% concentration of tech occupations, 1.8 times the concentration of the next highest metropolitan region, Greater Seattle. Also besting Greater Philadelphia’s tech concentration were some “up-and-coming" tech hubs, like Greater Austin, Greater Boston, and Greater San Diego, fast-growing Sunbelt areas like Greater Dallas, Greater Atlanta, and Greater Phoenix, as some former industrial cities with large and diverse employment ecosystems like Greater New York City, and some much smaller markets with burgeoning tech industries, like Greater Baltimore and Greater Detroit. Interestingly, Greater Philadelphia’s concentration of tech occupations slightly outpaced that of Greater Pittsburgh, by 0.1%. This shows how both of Pennsylvania’s major metropolitan regions, despite their dissimilar size, have similar concentrations of tech jobs. Given the recent influx of large tech companies like Google and Meta to Greater Pittsburgh, however, the types of tech jobs are likely different than those in Greater Philadelphia [2].
Figure 4 compares the same 21 U.S. metropolitan regions’ change in tech occupations from 2021 to 2022. As shown in Figure 1, Greater Philadelphia saw a slight increase in tech occupations between 2021 to 2022, but Figure 4 shows that this slight growth was largely eclipsed by many peer U.S. metropolitan regions.
FIGURE 4
SOURCE: Data were obtained from annual estimates of the 2012 through 2022 U.S. Bureau of Labor Statistics’ Occupational Employment Statistics (OES) program.
Greater Philadelphia’s tech occupations grew 2.5% from 2021 to 2022, the third slowest growth rate of the 21 peer U.S. metropolitan regions. Only Greater San Diego and Greater Baltimore saw slower growth rates in tech jobs, while Greater Pittsburgh and Greater Boston saw declines. Many Sunbelt areas saw the largest growth rates between 2021 and 2022, particularly Greater Miami, Greater Austin, and Greater Atlanta, which posted double-digit growth rates of 15.0%, 14.1%, and 10.2%, respectively. These Sunbelt metropolitan regions of the Southeastern and Southwestern United States have seen significant employment growth across a variety of sectors, including tech [3]. Most tech hubs continued to grow their tech occupations between 2021 and 2020, especially Greater San Jose, Greater San Francisco, and Greater Seattle. Representing employment in 2022, these estimates may not reflect the more recent layoffs occurring across many major tech companies [4]. Interestingly, Greater Detroit, a significantly smaller metro than ours, saw its tech occupations grow at twice the rate of Greater Philadelphia’s; this could reflect the impact of Greater Detroit's reinvention of its local economy after some decades of economic stagnation [5].
A Near-Future Outlook
Greater Philadelphia’s tech sector seems to be establishing a ‘new normal’ as it recovers from the COVID-19 pandemic. While it did not follow the trajectories of more vulnerable sectors, like the very hard-hit Food Accommodations and Hospitality industries, the region’s tech sector went through its own recovery pains. After a slight decline in employment in 2021, it seems to be back on track with some growth in 2022. At the same time, we must recognize some of the recent major changes impacting national employment trends across the tech sector. Many large tech companies are restructuring and announced layoffs during the latter half of 2022, and 2023 recorded only more tech-related layoffs from major tech companies [4]. Our next annual analysis of Greater Philadelphia’s tech workforce may show how or if these layoffs deeply impacted our region’s tech workforce.
Works Cited:
[1] Cook, Ian. 2021. “Who Is Driving the Great Resignation?” Harvard Business Review, 15 September. Retrieved from: (https://hbr.org/2021/09/who-is-driving-the-great-resignation?pStoreID=epp?jumpid=ps_wwsupplies).
[2] Irvin-Mitchell, Atiya. 2023. “Is Big Tech’s presence in Pittsburgh a boon for founders and technologists? Some say yes, but it’s complicated.” Technical.ly, 23 February. Retrieved from: (https://technical.ly/startups/big-tech-in-pittsburgh-founders/).
[3] Bailey, Tom. 2016. “The Sun Belt shines for US tech and manufacturing.” The New Economy, 22 October. Retrieved from: (https://www.theneweconomy.com/strategy/the-sun-belt-is-the-driving-force-behind-continued-us-success-in-tech-and-manufacturing).
[4] Mascarenhas, Natasha and Alyssa Stringer. 2023. “A comprehensive list of 2023 tech layoffs.” TechCrunch, 8 May. Retrieved from: (https://techcrunch.com/2023/05/09/tech-industry-layoffs/).
[5] Detroit Regional Partnership. n.d. “Digital Technology Industry in the Detroit Region.” Detroit Regional Partnership. Retrieved from: (https://www.detroitregionalpartnership.com/digital-technology/).
APPENDIX A