The Impact of the Pandemic on Greater Philadelphia's Tech Workforce
Last week, Greater Philadelphia celebrated Philly Tech Week – an annual showcase of the region’s growing technology organizations, innovations, and advances. Events for this year were largely focused on the build-back from the COVID-19 pandemic and the future of work. A year ago, we hypothesized that the region’s tech sector would help buoy employment losses during the pandemic and significantly contribute to the region’s recovery. Although qualitative evidence points towards our collective mastery of Zoom and Microsoft Teams (among other remote work technologies) thanks to tech workers, new occupational estimates from the U.S. Bureau of Labor Statistics allows us to test our hypothesis and see how Greater Philadelphia’s tech sector fared through the pandemic.
Key Takeaways
- From 2012 to 2020, the concentration of Greater Philadelphia’s tech workforce has remained slightly lower than the average concentration across the 15 largest U.S. metropolitan areas.
- Between 2019 and 2020, there was a net increase of roughly 22,500 tech jobs across the 15 largest U.S. metropolitan areas during the COVID-19 pandemic
- Greater Philadelphia was among nine metropolitan areas to see a net increase in tech employment during the COVID-19 pandemic, but the region’s net increase was the smallest among its peers, just 410 jobs in a sector with over 100,000 employees.
- Tech job posts in the City of Philadelphia were second only to “Healthcare Practitioners and Technical Occupations” posts during the early months of the pandemic.
Greater Philly’s Tech Workforce in the Pandemic
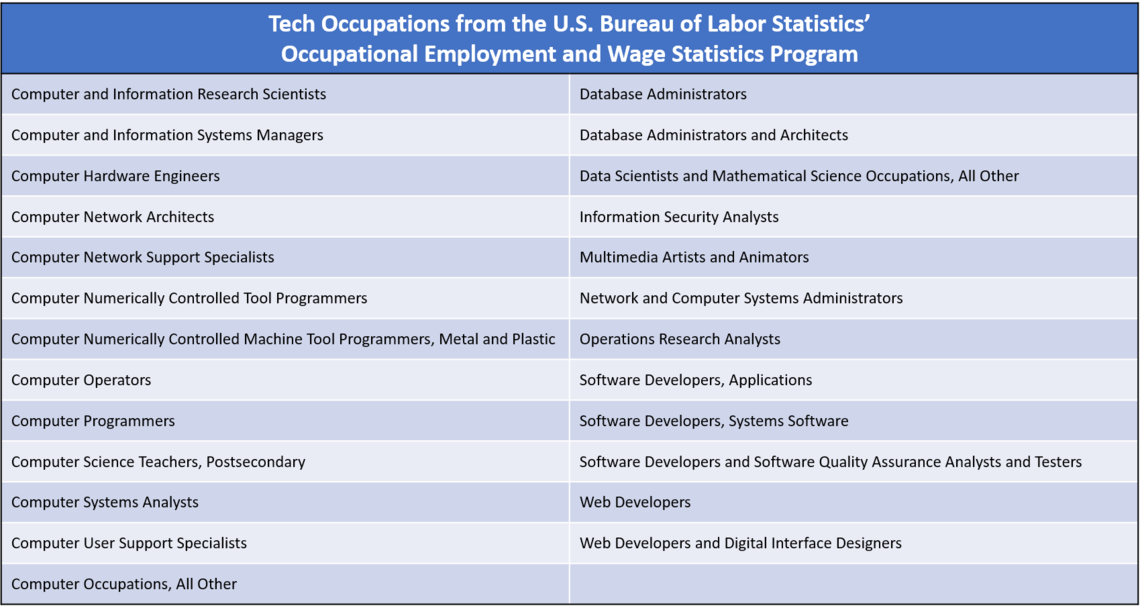
As we have previously noted, the tech sector is not a single industry classification but encompasses a wide variety of occupations across multiple industries. In today’s technology-driven economy, it is not uncommon to find a software developer working at a bank or hospital or a data analyst working at a nonprofit. Consistent with the methodology used in our previous 2017 report on the region’s tech workforce and its 2019 update we aggregated various tech-related occupations to capture the unique size and shape of this sector within the region. Tech occupations were chosen based on their primary function and transferability; thus, various field-specific tech occupations (e.g., health technologists or technicians, biomedical engineers, etc.) were excluded. A full list of tech occupations is listed in Appendix A.
Figure 1 shows the concentration of Greater Philadelphia’s tech workforce from 2012 to 2020 in comparison with the average concentration of the tech workforce across the top 15 largest U.S. metropolitan regions.

FIGURE 1
SOURCE: Data were obtained from annual estimates of the U.S. Bureau of Labor Statistics’ Occupational Employment Statistics (OES) program.
Figure 1 shows how the tech workforce’s concentration, both in Greater Philadelphia and across the 15 largest U.S. metropolitan areas, has been steadily growing since 2012. However, the concentration of Greater Philadelphia’s tech workforce is slightly lower than the average concentration across the 15 largest U.S. metropolitan areas - averaging at roughly a 0.7 percent difference during the nine-year period. Greater Philadelphia’s concentration, however, has grown at a slightly quicker pace than the average metropolitan concentration, with an annual average growth rate of 0.08 percent - twice the annual average growth for the 15 largest U.S. metropolitan areas during the same time period.
The concentrations of the tech workforce in both Greater Philadelphia and across the 15 largest U.S. metropolitan areas saw above average increases amid the COVID-19 pandemic. Yet, figure 2 shows how both tech job growth and overall employment loss helped to increase tech workforce concentrations.
FIGURE 2
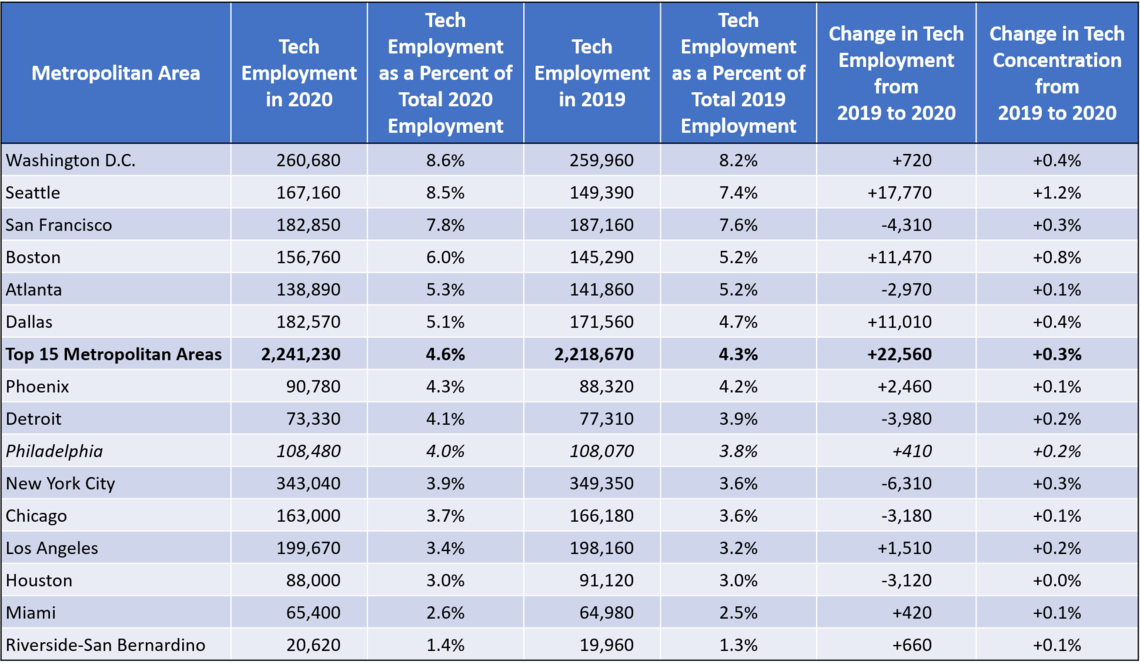
SOURCE: Data were obtained from annual estimates of the U.S. Bureau of Labor Statistics’ Occupational Employment Statistics (OES) program.
Figure 2 shows that many metropolitan areas, like Greater Philadelphia, saw net tech employment gains between 2019 and 2020. In fact, there was a net increase of roughly 22,500 tech jobs across the 15 largest U.S. metropolitan areas during the COVID-19 pandemic, with Greater Philadelphia accounting for 410. Many metropolitan areas, however, saw decreases in their tech employment but corresponding increases in their tech workforce concentrations (see San Francisco, Atlanta, Detroit, New York City, and Chicago). These areas saw significantly higher job losses in other industry sectors during the pandemic, thus the concentrations of their tech occupations grew because the denominator of total jobs retracted. Yet even with this contraction in some metropolitan areas, it seems that the tech workforce helped buoy many metropolitan workforces during the pandemic.
Philadelphia’s Tech Job Postings
Job postings provide another measure of the tech workforce's vitality during the COVID-19 pandemic. Using data collected and maintained by Philadelphia Works, figure 3 shows the indexed growth of job postings in the City of Philadelphia for various occupational categories from February 2020 to January 2021. The “Computer and Mathematical Occupations” category can be used as a proxy measure for tech job postings.

FIGURE 3
SOURCE: Data were obtained from Philadelphia Work’s Philadelphia Job Postings Over Time page of the COVID-10 Impact on Philadelphia Dashboard.
Figure 3 demonstrates that tech job postings in Philadelphia saw a smaller decline than many other occupational categories. Only job postings for “Healthcare Practitioners and Technical Occupations” outpaced “Computer and Mathematical Occupations” from April to July – which makes sense given the nature of the crisis. Tech job postings also fared much better than “Educational Instruction and Library Occupations” and “Food Preparation and Serving Related Occupations” job postings which still remain far below their February 2020 level. Tech job posts also outpaced most other “white-collar” occupations until mid-summer 2020 when tech postings began to decline and reach their lowest point in November 2020. As of January 2021, however, the number of tech job posts is second only to “Healthcare Practitioners and Technical Occupations”. This largely reflects the importance of the tech workforce’s role in the city amid the pandemic and its recovery.
The Resilience of Tech in a Health and Economic Crisis
As predicted a year prior, Greater Philadelphia’s tech workforce played a modest role in keeping the regional economy afloat at the onset of the COVID-19 pandemic. When stay-at-home orders took place, it was the region’s tech workforce who buoyed many businesses and industries from closing. Thus, it is important to remember how technology and tech workers allowed the region’s economy to pivot amid health and economic crises. Building back a more resilient regional economy will require greater investment in the regional tech workforce and building up tech-focused businesses – particularly those working to include new and diverse perspectives to Greater Philadelphia’s tech workforce. With a diversity of expertise and perspectives, Greater Philadelphia’s tech industry can continue to grow and better compete with other major metropolitan areas.
APPENDIX A