Detroit: The Rise and Fall of a Public Transit System
We continue our Leading Indicator series focused on Detroit as we prepare to convene 150 Philadelphia civic and business leaders for the Greater Philadelphia Leadership Exchange (GPLEX) in the Motor City this October. In this edition, we examine the state of Greater Detroit's public transportation, its organization, its historic trajectory, and its future.
What You Need to Know
- The City of Detroit currently has no railway line that connects neighborhoods in the city to the surrounding suburbs.
- There are two light rails running within the city, the Detroit People Mover and Q-Line, that cover 2.9 and 3.3 miles respectively. By comparison, SEPTA’s rail system comprises 39.8 miles of heavy rail rapid-transit lines and 39.6 miles of trolley lines.
- The most prevalent form of public transportation in Greater Detroit are buses which are operated by the Suburban Mobility Authority for Regional Transportation (SMART) and the Detroit Department of Transportation (DDOT).
- The urban population and land area served by Greater Detroit’s public transportation is almost 30 percent smaller than those serviced by SEPTA in Greater Philadelphia.
- Combined, SMART and DDOT bus systems in Greater Detroit have provided an average of 83 trips per 100 residents; this is almost 166 trips less than SEPTA and DART’s average trips of 250 per 100 residents.
- Between 2002 and 2022, public buses in Greater Detroit travel an average of 50 miles per 100 people compared to the 72 miles per 100 people traveled by SEPTA in Greater Philadelphia.
- Combined, SMART and DDOT bus systems in Greater Detroit operate 3.4 hours per 100 people compared to an average of 6.7 hours per 100 people by SEPTA and DART in Greater Philadelphia
- The public transportation system in Greater Detroit does not operate under an umbrella transit authority, as in many peer U.S. cities. This has led to fragmentation of the public transit network and infrastructure in the region.
- Since 1991, the metropolitan area of Detroit has only received roughly $23 per capita in average funding from federal, state, and local governments to develop its public transit infrastructure compared to $58 per capita in Greater Philadelphia.
Public transportation and economic opportunity are intimately linked in urban centers around the world [1]. Modes of public transportation connect people to job opportunities and stimulate economic growth in cities by linking different neighborhoods and enabling exposure to culture and ideas. Lack of reliable public transit imposes severe socioeconomic constraints on a major city. Over the last 70 years, a mixture of inadequate funding from federal and state governments combined with a patchwork of transit services that never consolidated under an umbrella authority led to a fragmented and ineffective public transportation infrastructure in Greater Detroit. In this Leading Indicator, we shed light on the current state of public transportation in Greater Detroit by exploring its historical trajectory and benchmarking its recent performance metrics to that of Greater Philadelphia’s Southeastern Pennsylvania Transportation Authority (SEPTA).
Historical Background of Detroit’s Public Transit Infrastructure
In the pre-WWII era, Detroit had a robust public transit system; the city boasted the country’s largest municipally owned network of electric streetcars [2]. In fact, in its early days, Detroit’s public transit infrastructure was on par with some of the nation’s great urban public transit systems. Detroit's shrinking public transit system aligned with a general national trend of automobile-centric infrastructure investment in the 1950s that posed an existential threat to the viability of many urban public transit systems. [3]. But while Detroit experienced similar challenges to those encountered by comparable U.S. cities at similar periods in time, it was the specific decisions made by city and state officials and voters in reaction to these challenges that forced further setbacks to Detroit’s public transportation.
One of the most unique features of Detroit’s transit ecosystem—aside from its lack of an underground subway system—is its patchwork of regional, local, and hyperlocal transit systems. These include the Detroit Department of Transportation (DDOT), the Suburban Mobility Authority for Regional Transportation (SMART), the Detroit People Mover, and the QLINE. In recent years, actions have been taken to improve how these individual systems interact with one another—for example, the introduction of DART in August 2019, a universal payment pass which allows for more seamless transfers between these transit systems [4]. This is the start of a challenging road to unify the fragmented public transit infrastructure in Greater Detroit.
Such patchwork systems have, at times, been a feature of many public transit systems in U.S. cities. In many cases, cities and states were forced to step in to take over bankrupt private transit entities and consolidate them under the umbrella of a single regional transit authority. In the case of the Southeastern Pennsylvania Transportation Authority (SEPTA), which was created by the Pennsylvania state legislature in 1963 [5], the goal was to coordinate federal funding dollars among existing systems in the Greater Philadelphia region. In doing so, the state would be able to play a critical role in connecting subsidies to each component of the greater system—be it the subway, buses, trolleys, or regional rail. Southeastern Michigan’s equivalent, the Regional Transit Authority (RTA), was created in a similar manner and for a similar purpose decades later in 2012. Earlier attempts at creating such an authority had been made prior—in fact, SMART is derived from an earlier iteration of this idea, the Southeastern Michigan Transportation Authority (SEMTA)—but it lacked a permanent funding source to sustain itself [6].
Figure 1 shows the funding available to public transport organizations in Greater Detroit and Greater Philadelphia by different levels of government. SEPTA, the main and largest transit authority that serves Greater Philadelphia, has received more funding per capita from state and federal governments than all four transport authorities in Greater Detroit combined. Interestingly, funding from local governments for public transit has almost always been higher in Greater Detroit for the past 30 years, when compared to Greater Philadelphia, but this gap has closed since 2010. The vast difference in federal and especially state funding highlights the inadequate support Detroit has received for its public transit infrastructure.
FIGURE 1
Source: National Transit Database
Public Transit in Greater Detroit and Philadelphia
Detroit has a unique public transportation system compared to other major cities in the U.S. Unlike many peer U.S. cities, there is no rail system that runs within Detroit and connects city neighborhoods with the surrounding suburban communities. There are smaller rail systems that connect specific neighborhoods within the city (the Detroit People Mover and the Q-Line), but they only cover 2.9 and 3.3 miles within the city, respectively [7], [8]. Table 1 shows the types of public transit currently in operation in Greater Detroit and Greater Philadelphia as well as the urbanized land area and population they serve.
TABLE 1
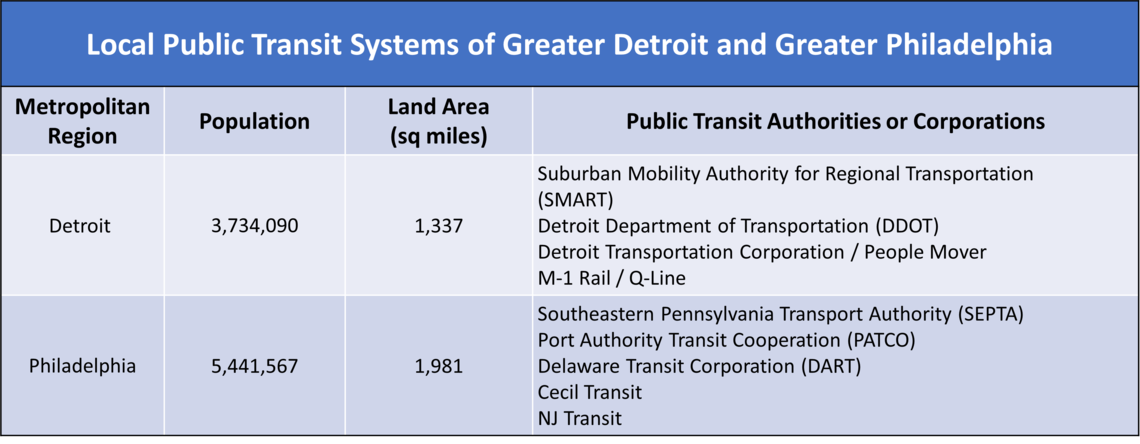
Source: Federal Transit Administration. It is important to note that the land area and population numbers in this table represent the number of people and area serviced by the public transit authorities in Greater Detroit and Philadelphia.
Given the unique transit landscape of Greater Detroit, public buses operated by SMART and DDOT are the most prevalent and—in most cases—the only form of public transportation in the city. Therefore, for our comparative analysis of public transit systems, we focus solely on SMART and DDOT buses in Greater Detroit along with SEPTA and DART buses in Greater Philadelphia. With population and land area roughly 70 percent the size of Greater Philadelphia, Greater Detroit makes for a relatively robust comparison. As we pointed out in our first Leading Indicator of this series [9], both metropolitan regions also went through a similar history of industrial decentralization which makes Greater Philadelphia’s investment in public infrastructure an interesting counterpoint to the one in Greater Detroit.
In order to understand the differences in public transit performance between the two areas, figure 2 visualizes key statistics provided by the Federal Transit Administration [10] on passenger trips and network concentration. The first graph in the top left corner of figure 2 details the number of Unlinked Passenger Trips (UPT), or the number of times a passenger boards public transit vehicles, in Greater Detroit and Greater Philadelphia from 2002 to 2022.
FIGURE 2
Source: National Transit Database
UPT is a common metric for public transit use and size. If a passenger only takes a train between her origin and destination, it is counted as one UPT. If she takes a bus after her train ride to reach her destination, it is recorded as two UPTs. The top left graph of figure 2 normalizes UPT estimates for passengers using the SMART and DDOT bus system in Greater Detroit and the SEPTA and DART bus system in Greater Philadelphia by every 100 individuals within the metropolitan population. Over the twenty-year-period shown in figure 2, the average UPT ridership in Greater Detroit has been 83 trips per 100 people. In comparison, SEPTA and DART buses provided almost 166 more trips than Greater Detroit’s bus system with an average of 250 trips per 100 people. SEPTA and DART’s UPT performance is relatively average when compared to other metropolitan transit systems, like Greater New York City's MTA or Greater Boston's MBTA, but Greater Detroit trails most major metropolitan systems in UPT. The only time the average UPT rides provided by SEPTA and DART buses came close to the ones in Greater Detroit was during the COVID-19 pandemic. SMART and DDOT buses in Greater Detroit saw a further decline in their already low ridership during the pandemic and have continued to decrease in 2022, whereas SEPTA and DART ridership in Greater Philadelphia has rebounded since 2021.
Detroit's SMART and DDOT buses also trail public buses in Greater Philadelphia in Vehicle Revenue Miles (VRM) and Vehicle Revenue Hours (VRH) during the same period. Vehicle Revenue Miles (VRM) are the number of miles travelled by transit vehicles during their operating hours. They provide a rough estimate of how extensive public transit networks are in connecting different areas of a city. Prior to 2005, SMART and DDOT buses in Greater Detroit used to travel similar distances when compared to SEPTA and DART, but they have continued to decrease ever since. This points to a shrinkage in the public bus network in Greater Detroit over the last 20 years compared to the largely stable operations of public buses in Greater Philadelphia.
The same story holds when we compare the number of Vehicle Revenue Hours (VRH) (bottom left of figure 2) of public buses in the two metropolitan areas. VRH are the number of hours operated by transit vehicles during revenue service. This gives us an estimate of how often transit vehicles run their routes on any given day. Once again, there has been a significant difference between hours of operation between the two public bus systems, where SMART and DDOT buses average only 3.4 hours per 100 people in Greater Detroit compared to 6.7 hours per 100 people operated by SEPTA and DART buses in Greater Philadelphia. This means that SEPTA and DART buses run almost twice as often on any given day and route compared to SMART and DDOT buses.
In addition to the overall performance of the public bus system, current transit buses in Greater Detroit also have less passenger capacity compared to the ones in Greater Philadelphia. The bar plot in figure 2 (bottom right) shows that while the average age of transit buses is lower in Greater Detroit, they do have less standing and seating capacity than SEPTA buses. Similarly, there are 20 buses per 100,000 people actively operating in Greater Detroit compared to roughly 25 buses per 100,000 in Greater Philadelphia. These numbers show a significant difference in the public transit infrastructure between Greater Detroit and Greater Philadelphia despite the comparable land area and population size of the two regions.
Conclusion
As we have highlighted in our previous Leading Indicators [11], [12], there are a variety of factors that explain the socioeconomic contraction of Detroit over the last 70 years. Inadequate public transit has certainly played a key role in inhibiting access to economic opportunities for residents in Greater Detroit. The organizational patchwork of transit authorities combined with inadequate funding from state and federal governments has contributed to the low number of trips and sparse network observed in Greater Detroit.
Works Cited
[1] M. Bouchard, “Transportation Emerges as Crucial to Escaping Poverty,” The New York Times, May 07, 2015. Accessed: Aug. 09, 2022. [Online]. Available: https://www.nytimes.com/2015/05/07/upshot/transportation-emerges-as-cru…
[2] “Cultivating a Culture of Transit.” https://www.planetizen.com/features/112361-cultivating-culture-transit (accessed Aug. 09, 2022).
[3] J. R. Short, “Why is the U.S. unwilling to pay for good public transportation?,” The Conversation. http://theconversation.com/why-is-the-u-s-unwilling-to-pay-for-good-pub… (accessed Aug. 10, 2022).
[4] “Detroit transit agencies launch Dart app for mobile transit payments and passes, powered by Passport - Passport.” https://www.passportinc.com/blog/detroit-transit-agencies-launch-dart-a… (accessed Aug. 09, 2022).
[5] “About | SEPTA,” Southeastern Pennsylvania Transportation Authority. https://www5.septa.org/about/ (accessed Aug. 09, 2022).
[6] D. Gifford, “Detroit’s 5 biggest transit misses,” Curbed Detroit, Apr. 20, 2020. https://detroit.curbed.com/2020/4/20/21224917/detroit-regional-transit-… (accessed Aug. 09, 2022).
[7] “The Detroit People Mover | DPM.” https://www.thepeoplemover.com/about-us (accessed Aug. 09, 2022).
[8] Z. Creative, “QLINE Detroit,” QLINE Detroit. https://qlinedetroit.com (accessed Aug. 09, 2022).
[9] “Economy League – A Philadelphia-Detroit Comparison: The Populations.” https://economyleague.org/providing-insight/leadingindicators/2022/06/2… (accessed Aug. 09, 2022).
[10] “National Transit Database (NTD) Glossary | FTA.” https://www.transit.dot.gov/ntd/national-transit-database-ntd-glossary#U (accessed Aug. 09, 2022).
[11] “Economy League – A Philadelphia-Detroit Comparison: The Economies.” https://economyleague.org/providing-insight/leadingindicators/2022/07/1… (accessed Aug. 09, 2022).
[12] “Economy League – Detroit: Past and Future of a Shrinking City.” https://economyleague.org/providing-insight/leadingindicators/2022/07/2… (accessed Aug. 09, 2022).