A Philadelphia-Detroit Comparison: The Economies
We continue our series comparing Philadelphia and Detroit as we prepare to convene 150 Philadelphia leaders in Detroit for the Greater Philadelphia Leadership Exchange (GPLEX) in October 2022. In this Leading Indicator, we examine both the past and present economic conditions of Detroit to better understand the current socioeconomic landscape.
What You Need to Know
- Detroit’s centralization of the automobile industry in the twentieth century resulted in a massive economic boom from 1900 to 1950, but the lack of industry diversification contributed heavily to its economic downfall during the latter half of the century.
- Service-sector businesses and employment are growing in Detroit’s central business districts, but this growth has been uneven. The focus on downtown development has also led to tensions with outlying neighborhoods which have seen little growth.
- As of 2021, four of the top five largest industries by employment in both Philadelphia and Detroit’s home county, Wayne County, are the same. These industries are healthcare (accounting for 31.8% of Philadelphia’s total employment and 18.7% of Wayne County’s employment), local government (accounting for 11.8% of Philadelphia’s total employment and 9.0% of Wayne County’s employment), professional services (accounting for 10.7% of Philadelphia’s total employment and 9.4% of Wayne County’s employment), and retail trade (accounting for 8.9% of Philadelphia’s total employment and 11.4% of Wayne County’s employment).
- At 31.8 percent of the labor force in 2021, Philadelphia’s healthcare industry employs nearly twice the proportion of its counterpart in Wayne County (18.7 percent).
- Manufacturing remains the second largest industry by employment in 2021 in Wayne County. It accounts for roughly 15.7 percent of Wayne County’s total employment compared to just 3.5 percent in Philadelphia.
- As of 2021, Wayne County tends to either match or even outpace Philadelphia in its total number of private employer establishments across industries, except for healthcare.
- Workers in Philadelphia tend to earn slightly higher incomes across most industry sectors than those in Wayne County.
- Professional service-sector occupations offer the highest average annual incomes in both counties as of 2021, with the finance and insurance industry recording the highest average annual income in Philadelphia at $142,000 while the professional and technical services industry recorded the highest average annual income in Wayne County at roughly $109,000.
- In both Philadelphia and Wayne County, the lowest paying occupations are the ones with lower barriers to entry, like retail and administrative and waste services. Workers in these industries earned average annual incomes below $40,000 in both cities in 2021.
- Between 1990 and 2020, unemployment in both Philadelphia and Wayne County was at its lowest—5.6 percent and 4.0 percent respectively—during the dot-com boom of the 1990s as well as during the economic recovery from the Great Recession of 2008.
- The highest rates of recent unemployment occurred during the COVID-19 pandemic when unemployment in Wayne County stood at 13.5 percent and in Philadelphia at 12.4 percent.
- Both counties recovered most of the jobs lost during the pandemic, with current unemployment rates matching rates in 2014.
- Both Philadelphia and Wayne County have high poverty rates. Between 2003 and 2020, both recorded poverty rates higher than 20 percent and a median household income (the combined income of all earners in a single household) below $50,000.
- From 2003 to 2020, Philadelphia had a higher rate of poverty (on average 10.9% higher) than Wayne County as well as slightly lower median household income (on average 9.8% lower).
- Poverty levels in Philadelphia and Wayne Counties are continuing to fall after reaching a recent peak in the early 2010s, and both counties have seen increases in their median household incomes, with Philadelphia surpassing Wayne County in 2020.
Detroit’s Economic History
While Detroit is well known as the epicenter of the U.S. automotive industry, its time as the Motor City only encompasses a third of the city’s history. Detroit’s earliest economy revolved around fur when it served as a trading outpost on the edges of Europe’s North American colonies. With strategic access to both the Great Lakes and interior forests and lakes, trappers would hunt and sell fur from Detroit to traders on the east coast who would subsequently ship the wares to Europe [1]. Like much of North America, the early Detroit economy relied to a degree on slave labor. While not at the scale of the plantation systems of the American South, there is ample evidence that African and indigenous slaves were forced to build many of the early structures of Detroit as well as serve wealthier households [1,2].
Detroit did not see consistent economic or population growth until the mid- to late-nineteenth century when early industrialization began to take root. Detroit’s growth trajectory changed substantially with the construction of the Erie Canal, which connected the Great Lakes to eastern cities and positioned Detroit as a waystation for the transportation of goods [3]. As a result, shipping and transportation became increasingly important industries of nineteenth century Detroit, which set the foundation for manufacturing [3]. By the late 1800s, Detroit was a major center for ship building, cigars and tobacco production, pharmaceuticals, beer, rail cars, and foundry and machine shop products [4]. By the turn of the twentieth century the largest industry was the manufacturing of heating and cooking stoves. In fact, Detroit was the world’s largest manufacturer of stoves by the early 1900s earning the nickname the “Stove Capital of the World” [4,5]. The growing manufacturing sector produced numerous employment opportunities, leading to an influx of European immigrants, rural farmers, and African Americans seeking refuge from the Jim Crow South. In 1830, Detroit’s population was just over 2,000 residents; only thirty years later, in 1860, it increased to over 45,000.
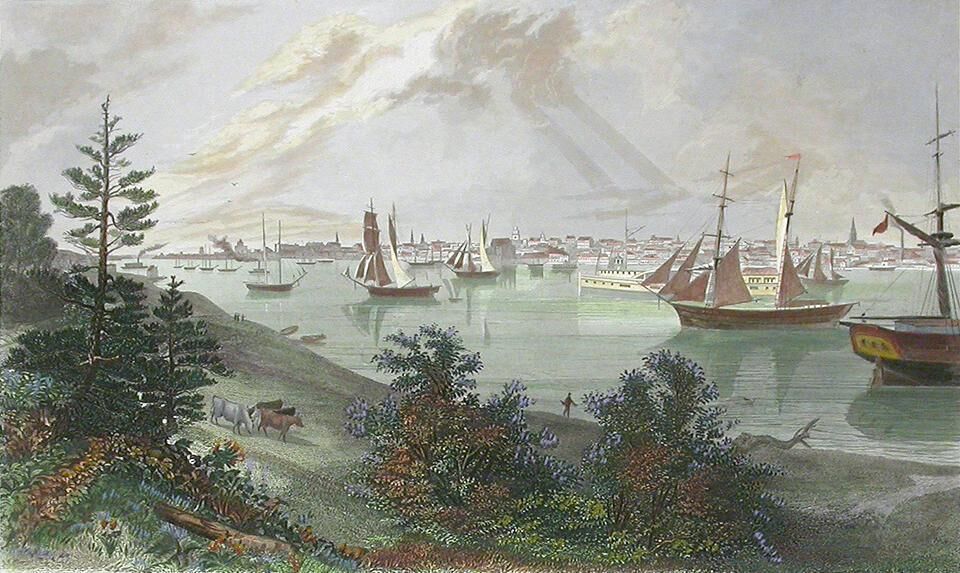
(The City of Detroit (from Canada Shore), 1872, by A. C. Warren)
With its strategic location among major shipping and rail lines as well as its wealth of existing machine production plants, Detroit was primed to become the center of the automotive industry. In 1899, Ransom E. Olds opened Detroit's first automobile manufacturing plant [4]. He would be followed in 1901 by Henry Ford (making his second attempt at automobile manufacturing after an initial failure) [4]. By 1914 Detroit was making half of the world’s automobiles [6]. The continued growth of Ford, General Motors, Chrysler, and other smaller automobile manufacturers solidified Detroit’s reputation as the Motor City [7]. The owners of these companies also took a large role in civic life, raising workers’ salaries to encourage Detroiters to buy the automobiles they made, battling unionization efforts, and pushing car-centric urban planning for the city [7,8]. By 1950, one-sixth of Detroit’s labor force was directly employed by the automotive industry [9]. Detroit’s economic future tightly wound itself around the automobile industry.
The Great Depression hit Detroit especially hard. With so many individuals unemployed across the country, automobile sales plummeted; General Motors cut its employment in half between 1928 and 1932 [10]. The US entry into World War II abruptly reversed Detroit’s fortunes. Detroit’s deep manufacturing base redirected efforts to the production of tanks and planes for the war effort [11]. There was also an increased demand for labor as many young men joined the armed services, leading to a second major wave of Black migration from the South into Detroit. In fact, between 1940 and 1950, more than two-thirds of Detroit’s Black population was born in a Southern state [12]. Because of Detroit’s massive contribution to the war effort, President Franklin Roosevelt nicknamed the city the “Arsenal of Democracy” [11]. By the end of the war, production and consumerism were increasing and Detroit’s population and workforce reached its highest level in 1950 [13].
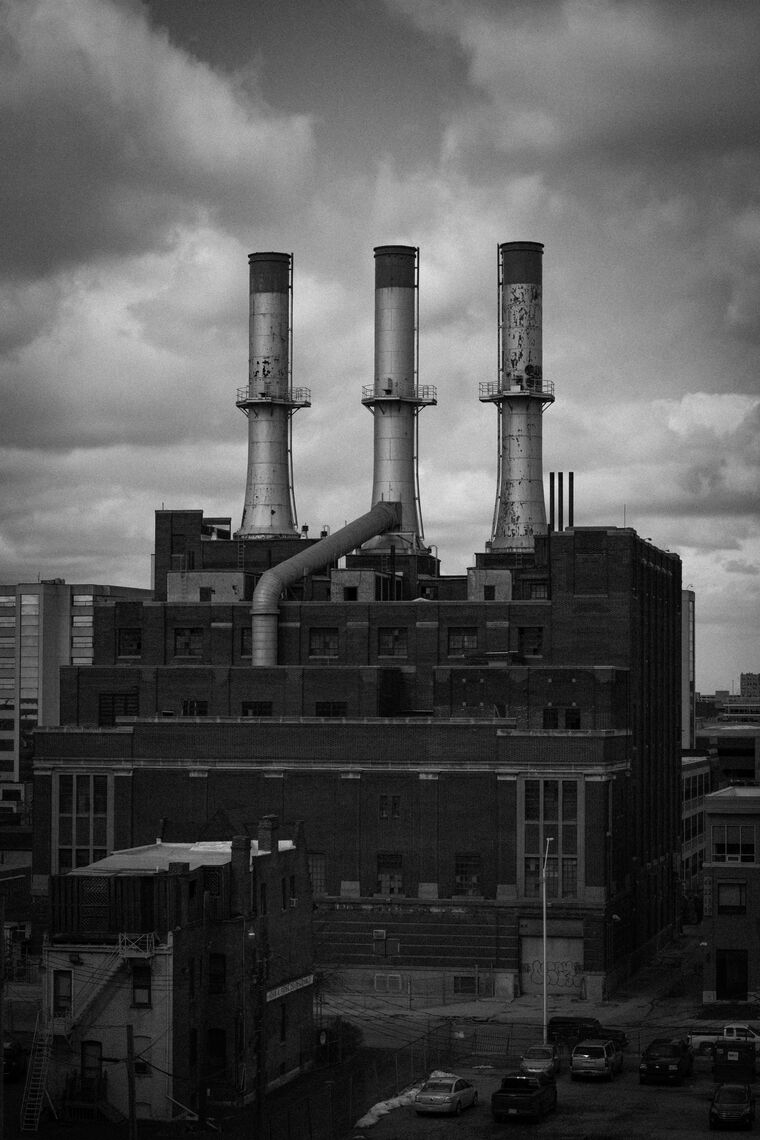
(A Detroit Factory)
While the city’s economy grew during and after World War II, employment was not equally distributed across Detroit’s population. Black workers faced discrimination by both Detroit’s employers and organized labor. They were pushed to lower-paying jobs throughout Detroit’s prosperous industries and denied access to many labor unions [14,15]. De facto segregation became a key feature of Detroit’s economy and a rally point for its growing civil rights movement [14]. The lackluster response by the city and its major employers contributed to the explosive 1967 Detroit riot. The impact of the riot led to the accelerated exodus of white-owned businesses and residents from the city and into the suburbs – exacerbating a trend that had begun by the late 1950s.
Global competition, as well as the rising cost of labor, pushed the automotive industry to consider new strategies to cut costs by the late 1950s. Automation, agglomeration, relocation to areas with cheaper taxes and labor costs, and shutdowns became common across Detroit’s industries. Deindustrialization hit Detroit hard. Between 1948 and 1967, Detroit lost more than 130,000 manufacturing jobs [9]. Middle-income and wealthier white workers could and did follow the jobs out of Detroit. Many found new employment opportunities and homes in the surrounding suburbs, while many others left the region entirely [16]. Black Detroiters had far fewer opportunities to move away and were forced to watch the jobs and social services contract. Factories and plants were deserted and left to crumble while poverty grew rapidly.
Deindustrialization and population decline continued from the 1950s into the 2000s. The automotive industry still maintained a large presence in the metropolitan region, but it continued to cut production and employment. Its domineering presence in the city began to fade by the 1990s. By this time the majority of jobs in the city were low-wage service sector occupations [15]. There was little that city leaders could do to rebuild its hollowed-out tax base – although some did try by investing in new development opportunities downtown while others got wrapped up in scandal. Growing debt and political scandal forced the city to declare bankruptcy in 2013, the first major American city to do so [17]. The city’s philanthropic community, along with state support, paid off the city’s debt and stabilized the city’s finances, allowing the city to exit bankruptcy by December 2014 [15]. This, however, made it very difficult to attract external businesses and employers to the city; growth and resurgence would have to come from within.
Bankruptcy presented an opportunity for a new crop of entrepreneurial business leaders. The low cost of public land allowed a handful of Detroit-born billionaires to make major investments and formulate plans for urban revitalization – most notably, Dan Gilbert, co-founder of Quicken Loans [18]. Most of these revitalization efforts have been concentrated in the downtown and Midtown neighborhood, as these billionaires continue to purchase public lots with the intention of housing both their businesses and employees. In fact, Gilbert and Quicken Loans have incentivized employees to live in the Central Business District or Midtown areas with various subsidies and loans [19]. The influx of office workers and residents created demand for new service-sector businesses and employment opportunities, yet much of the recent resurgence has been isolated downtown. These efforts face stiff criticism from many long-time residents living in surrounding neighborhoods who argue that these strategies—to attract external businesses and a 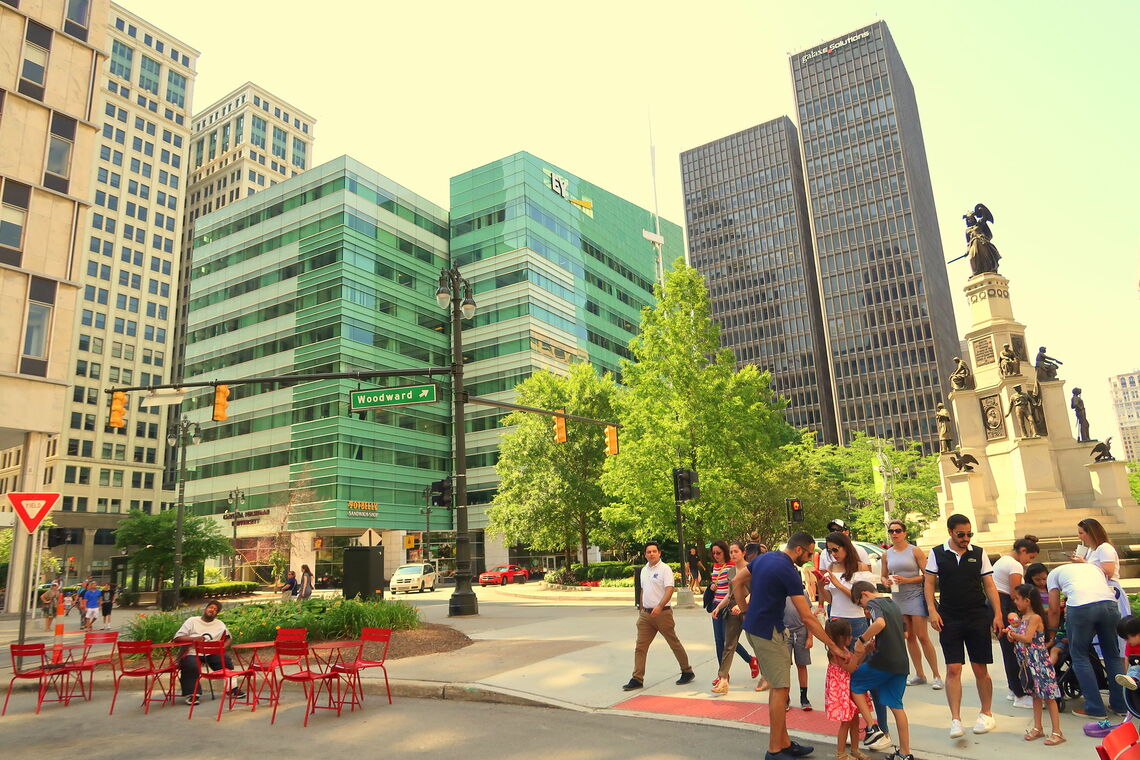 young, professional, and largely white workforce—continue to neglect the city’s Black and Brown residents [20, 21]. Thus, there is a growing “downtown-vs-neighborhoods" dynamic within the city’s political and civic spheres. Nonprofits and community-led efforts are focused on employment opportunities within Detroit’s neighborhoods, but they continue to face a legacy of disinvestment and distrust that has made it difficult to build comprehensive programming for the city’s poverty-burdened residents [22].
(Downtown Detroit)
The Economic Comparison
We use the rest of this brief to compare key economic metrics of Philadelphia and Detroit. The cities share some parallel history and economic trends. However, because the Bureau of Labor Statistics limits its estimations of employment, wage, and establishment to geographies of certain sizes, the following comparison uses estimates from Philadelphia and Wayne County – the county that contains the entire City of Detroit as well as some outlying municipalities. Figure 1 provides a basic breakdown of key demographics between Philadelphia and Wayne Counties.
FIGURE 1
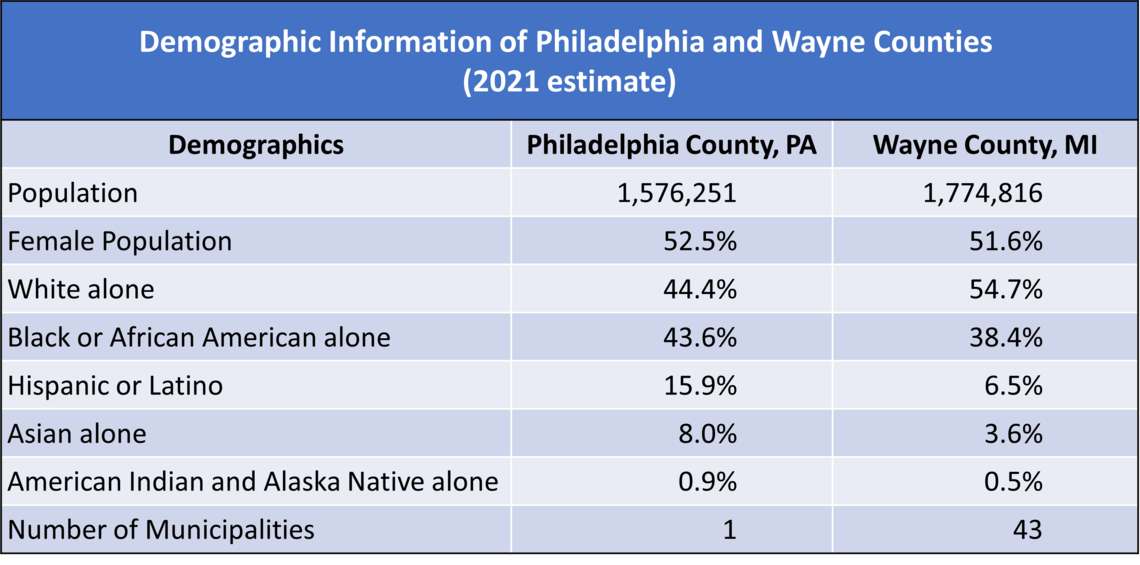
SOURCE: U.S. Census Bureau, 2021 QuickFacts
Major Employing Industries
Figure 2 provides a snapshot of the major employing industries of Philadelphia and Wayne Counties using 2021 estimates. Specifically, figure 2 shows the size of various industries using a proportion of total employment. There are some key similarities and differences to note between the two counties. First, four out of the top five largest industry employers in Philadelphia and Wayne Counties are the same. These industries are healthcare (accounting for 31.8% of Philadelphia’s total employment and 18.7% of Wayne County’s employment), local government (accounting for 11.8% of Philadelphia’s total employment and 9.0% of Wayne County’s employment), professional services (accounting for 10.7% of Philadelphia’s total employment and 9.4% of Wayne County’s employment), and retail trade (accounting for 8.9% of Philadelphia’s total employment and 11.4% of Wayne County’s employment). This highlights that the general makeup of the local workforce looks similar in both counties in terms of overall employment. The key differences, however, are the substantially larger healthcare sector in Philadelphia and Wayne County’s much larger manufacturing sector. At 31.8 percent, Philadelphia’s healthcare industry is almost twice as large as its counterpart in Wayne County, at 18.7 percent. On the other hand, manufacturing is still the second biggest employing industry in Wayne County, employing 15.7 percent of the workforce compared to just 3.5 percent in Philadelphia. This highlights Philadelphia’s greater reliance on service-sector industries, like healthcare, while the Detroit area still retains some of its legacy employment in manufacturing. Figure 2 does show, however, how similar the economies of both counties truly are as of 2021.
FIGURE 2
SOURCE: U.S. Bureau of Labor Statistics, Quarterly Census of Employment and Wages
Number of Establishments
Figure 3 compared the number of private employer establishments in Philadelphia and Wayne Counties as of 2021. The number of establishments in each county follows the overall level of employment previously shown in figure 2. Healthcare and retail have the first and second highest number of establishments in both areas, reaching over 4,000 in each case. An interesting takeaway from figure 3 is that Wayne County tends to either match or even outpace Philadelphia County in the total number of private establishments in most sectors, except for the healthcare industry. This is surprising given the fact that Wayne County’s population is much smaller than Philadelphia’s.
FIGURE 3
SOURCE: U.S. Bureau of Labor Statistics, Quarterly Census of Employment and Wages
Annual Income and Wages
Following from the overall makeup of the two economies, figure 4 shows the average annual income of each major industry in Philadelphia and Wayne Counties in 2021. Professional service-sector office jobs offer the highest average annual incomes in both counties. The finance and insurance industry recorded the highest average annual income in Philadelphia in 2021 at $142,000, while the professional and technical services industry recorded the highest average annual income in Wayne County in 2021 at roughly $109,000. Unsurprisingly, the lowest paying jobs are the ones with lower barriers to entry, like retail and administrative and waste services. These industries recorded average annual incomes of less than $40,000 in both cities in 2021. Since retail remains one of the largest industries in both counties (see figure 2), it is no surprise that both have retained higher than average poverty rates for many decades. A key takeaway from this comparison is that Philadelphia offers slightly higher incomes across most sectors when compared to Wayne County. This difference is especially salient in the highest paying sectors of the technical and financial services where employees in the same sector can earn almost 30 percent more in Philadelphia.
FIGURE 4
SOURCE: U.S. Bureau of Labor Statistics, Quarterly Census of Employment and Wages
Unemployment
Figure 5 compares unemployment rates in Philadelphia and Wayne Counties from 1990 to 2021. Both cities follow a similar overall trend in unemployment and reflect the national-level economic trends of the last 30 years. Philadelphia and Wayne County experienced their lowest phases of unemployment (5.6% and 4.0% respectively) during the economic dot-com boom of the 1990s as well as during the economic recovery from the Great Recession of 2008. On the other hand, the highest rates of unemployment came most recently during the COVID-19 pandemic, where Wayne County experienced a 13.5 percent loss in its labor force and Philadelphia saw a similar decrease of 12.4 percent. Both economies have recovered much of the employment lost during the pandemic with unemployment rates in 2021 matching 2014 levels.
FIGURE 5
SOURCE: U.S. Bureau of Labor Statistics, Local Area Unemployment Statistics
The most notable difference in unemployment trends between the two counties lies in the high volatility of unemployment in Wayne County when compared to the relatively stable rates experienced in Philadelphia during this time period. One potential reason for this volatility could be explained by the level of business diversification between the two regions. Detroit, the central city of Wayne County, has historically relied heavily on the automotive industry for employment, whereas Philadelphia’s economy hosts a greater diversity of industries as well as a larger proportion of large ‘anchor’ institutions like hospitals and universities [14]. As a result, Wayne County experiences economic downturns and upswings more drastically than Philadelphia.
Poverty and Household Income
Figure 6 tracks both counties’ poverty rates as well as their median household income from 2003 to 2020. Both trends emphasize the high degree of poverty experienced in both cities in recent years, with both Philadelphia and Wayne County recording poverty rates higher than 20 percent and a median household income far below $50,000 for the past two decades. Philadelphia has fared worse than Wayne County across both estimates despite having a much larger residential population. Throughout this 17-year period, Philadelphia had a higher rate of poverty (on average 10.9% higher) than Wayne County as well as slightly lower median household income (on average 9.8% lower). As a result, figure 6 shows that Philadelphia has experienced a higher rate of poverty than Wayne County for at least the last two decades; a closer comparison with only the City of Detroit may flip this trend. Fortunately, poverty levels are continuing to fall in both counties after reaching a recent peak in the early 2010s and both have seen increases in their median household incomes, with Philadelphia surpassing Wayne County in 2020.
FIGURE 6
SOURCE: U.S. Census Bureau, Small Area Estimates Branch
Conclusion
Now that we’ve covered Detroit’s general history and demographics as well as its economic history, our next Leading Indicators will take a closer look at some prevailing planning and development issues in Detroit to show how the city is attempting to use its existing resources to drive an economic and social resurgence.
Works Cited:
[1] Detroit Historical Society. 2022. “French Detroit (1700-1760).” Detroit Historical Society: Encyclopedia of Detroit. Retrieved from: (https://detroithistorical.org/learn/timeline-detroit/french-detroit-1700-1760).
[2] McGraw, Bill. 2020. “Slavery Is Detroit's Big, Bad Secret. Why Don't We Know Anything About It?” Deadline Detroit, 20 June. Retrieved from: (https://www.deadlinedetroit.com/articles/25564/slavery_is_detroit_s_big_bad_secret_why_don_t_we_know_anything_about_it).
[3] Detroit Historical Society. 2022. “Boomtown Detroit (1820 – 1860).” Detroit Historical Society. Retrieved from: (https://detroithistorical.org/learn/timeline-detroit/boomtown-detroit-1820-1860).
[4] Detroit Historical Society. 2022. “Industrial Detroit (1860 – 1900).” Detroit Historical Society. Retrieved from: (https://detroithistorical.org/learn/timeline-detroit/industrial-detroit-1860-1900).
[5] Loomis, Bill. 2015. “When stoves were the hot new thing.” The Detroit News, 24 January. Retrieved from: (https://www.detroitnews.com/story/news/local/michigan-history/2015/01/24/stove-capital-detroit-history/22234051/).
[6] Owens, Pamela Hilliard. 2015. “Voices of Detroit: The Great Depression.” El Moore. Retrieved from: (https://elmoore.com/2015/03/11/voices-of-detroit-the-great-depression/).
[7] Thompson, Karl. 2017. “The Rise and Fall of Detroit.” ReviseSociology, 20 September. Retrieved from: (https://revisesociology.com/2017/09/20/rise-fall-detroit-industrialisation/).
[8] Barrow, Heather. 2015. Henry Ford’s Plan for the American Suburb: Dearborn and Detroit. DeKalb, IL: Northern Illinois University Press.
[9] Sugrue, Thomas J. 2017. “Motor City: The Story of Detroit.” newsela, 1 March. Retrieved from: (https://www.nhclasses.org/uploads/1/1/8/4/118409200/newsela-motor_city_the_story_of_detroit.pdf).
[10] Hopper, Ben. N.d. “The Great Depression in Michigan.” MLPP: Michigan League for Public Policy. Retrieved from: (https://mlpp.org/announcement/the-great-depression-in-michigan/#).
[11] Detroit Historical Society. 2022. “Arsenal of Democracy.” Detroit Historical Society. Retrieved from: (https://detroithistorical.org/learn/encyclopedia-of-detroit/arsenal-democracy).
[12] Metzger, Kurt and Jason Booza. 2002. African Americans in the United States, Michigan and Metropolitan Detroit. Wayne State University: Center for Urban Studies, Working Paper Series No. 8. Retrieved from: (http://www.cus.wayne.edu/media/1356/aawork8.pdf).
[13] Shields, Mike. 2022. “A Philadelphia-Detroit Comparison: The Populations.” Economy League of Greater Philadelphia, Leading Indicators, 29 June. Retrieved from: (https://economyleague.org/providing-insight/leadingindicators/2022/06/29/phillydetroit1).
[14] Padnani, Amy. 2013. “Anatomy of Detroit’s Decline.” The New York Times, 8 December. Retrieved from: (https://archive.nytimes.com/www.nytimes.com/interactive/2013/08/17/us/detroit-decline.html).
[15] O'Donnell, Tommy. 2019. “Detroit: The Rise, Fall, and Rebirth of the Motor City.” Urban Utopias, 5 July. Retrieved from: (https://urbanutopias.net/2019/07/05/detroit/).
[16] Brown, David L. and John M. Wardwell. 1980. New Directions in Urban-Rural Migration: The Population Turnaround in Rural America. New York CIty, NY: Academic Press, INC.
[17] Reindl, JC. 2019. “5 years out of bankruptcy, can Detroit avoid another one?” Detroit Free Press, 9 December. Retrieved from: (https://www.freep.com/story/money/business/2019/12/09/detroit-bankruptcy-anniversary/2586744001/).
[18] Rafter, Dan. 2017. “Downtown surge doesn’t miss Detroit: Rejuvenation continues in city’s center.” REjournals, 8 June. Retrieved from: (https://rejournals.com/downtown-surge-doesnt-miss-detroit-rejuvenation-continues-in-citys-center/).
[19] Maestri, Courtney. 2011. “Companies offer incentives to live in Detroit: 'Live Downtown' program created to economically redevelop the city.” The South End, 28 July. Retrieved from: (https://www.thesouthend.wayne.edu/archives/article_4cb09661-419b-5d5a-a665-2118208a53dc.html).
[20] Aguilar, Louis and Christine MacDonald. 2015. “Detroit’s white population up after decades of decline.” The Detroit News, 17 September. Retrieved from: (https://www.detroitnews.com/story/news/local/detroit-city/2015/09/17/detroit-white-population-rises-census-shows/72371118/).
[21] Carlisle, John. 2020. “Detroit neighborhood group sees gentrification as the enemy.” Detroit Free Press, 24 May. Retrieved from: (https://www.freep.com/in-depth/news/columnists/john-carlisle/2020/05/24/detroit-neighborhood-gentrification-protest-carlisle/4954702002/).
[22] Live6 Alliance. N.d. “Live 6 Alliance: The Crossroads of Culture, Commerce, and Community.” Live6Detroit.org. Retrieved from: (https://live6detroit.org/live6alliance).