Greater Philadelphia’s Tech Workforce: Two Years into the Pandemic
In previous reports and briefs, the Economy League has noted that the region’s technology sector can offer new sustainable career building opportunities as well as anchor future inclusive growth and economic development. Recognizing the growth potential of this influential sector, we continue to monitor Greater Philadelphia’s tech occupations and how they have fared since the COVID-19 pandemic.
What You Need to Know
- Across the 15 largest U.S. metropolitan regions as well as in Greater Philadelphia, tech workforce concentrations have been steadily growing since 2012.
- In 2021, however, tech employment declined across many metropolitan regions including Greater Philadelphia.
- While remaining stable from 2019 to 2020, Greater Philadelphia’s tech employment declined by roughly 9,600 jobs from 2020 to 2021 – almost a 7.5 percent year-over-year decline.
- Largely due to increased demand and burnout in 2020, tech employment across the U.S. saw some of the highest quit and turnover rates as the labor market grew more competitive from 2020 to 2021.
- Of the 15 largest U.S. metropolitan regions, Greater Philadelphia had the tenth largest tech workforce in 2021 at 3.7 percent. By comparison, the tech workforces in Greater Seattle, Greater Washington D.C., and Greater San Francisco constitute more than eight percent of their total employment counts.
- With a 7.4 percent decline from 2020 to 2021, Greater Philadelphia saw the fourth highest contraction of its tech employment among the 15 largest U.S. metropolitan regions.
Greater Philadelphia’s Tech Workforce
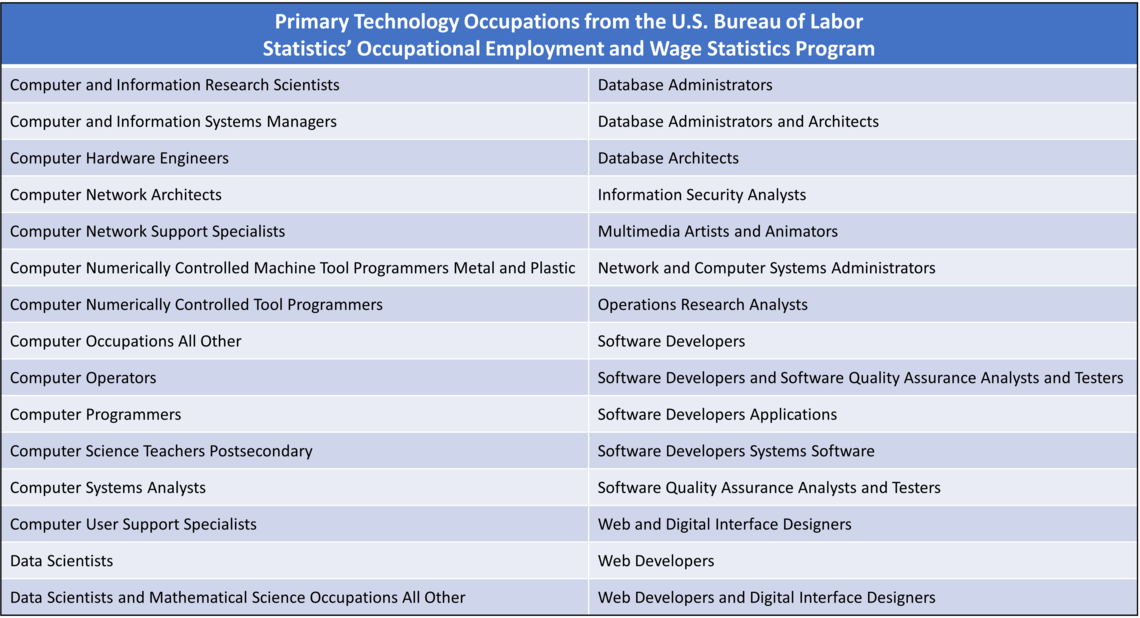
As we have previously noted, the technology sector is difficult to measure since tech occupations can be found across multiple industries. It is not uncommon to find a computer programmer working for a financial firm or bank or a software developer working at a major medical insurer. Recognizing this, we aggregated various tech-related occupation classifications to capture the unique size and shape of Greater Philadelphia’s tech workforce. Tech occupations were chosen based on their primary function and transferability; thus, various field-specific tech occupations (e.g., health technologists or technicians, biomedical engineers, electronics engineers, etc.) were excluded. A full list of tech occupations is listed in Appendix A.
Using our designation of tech occupations, figure 1 shows the concentration of Greater Philadelphia’s tech workforce from 2012 to 2021 in comparison with the average concentration of the tech workforce across the top 15 largest U.S. metropolitan regions. These concentrations represent the proportion of tech occupations out of total regional employment.

FIGURE 1
SOURCE: Data were obtained from annual estimates of the 2012 through 2021 U.S. Bureau of Labor Statistics’ Occupational Employment Statistics (OES) program.
Figure 1 shows that the tech workforce’s concentration has been steadily growing since 2012, both in Greater Philadelphia and across the 15 largest U.S. metropolitan areas. Greater Philadelphia’s tech occupation continues to remain slightly below the average tech concentration of the top 15 U.S. metropolitan regions, but the trend lines largely mirror one another – indicating that national shifts in the tech workforce equally impact Greater Philadelphia.
Figure 1 also shows that tech concentrations declined across all metropolitan regions in 2021. As we detailed in our previous tech workforce brief, the sudden uptick in tech workforce concentrations in 2020 is largely a statistical phenomenon and not truly reflective of employment growth in tech. This sudden increase resulted from the large decline in total regional employment during the economic lockdowns early in the pandemic. Tech occupations remained stable but accounted for a greater percentage of the region’s total employment as job losses mounted in other fields. To further illustrate how tech fared in 2021, figure 2 uses Greater Philadelphia’s raw tech employment estimates from 2012 through 2021 to better understand growth trends.
FIGURE 2
SOURCE: Data were obtained from annual estimates of the 2012 through 2021 U.S. Bureau of Labor Statistics’ Occupational Employment Statistics (OES) program.
As noted, Greater Philadelphia’s tech employment remained stable from 2019 to 2020. But from 2020 to 2021, the region’s tech employment fell by roughly 9,600 jobs—a nearly 7.5 percent decline—leaving the region’s tech employment at its lowest level since 2017. This contraction may reflect the later pandemic-era trend of workers changing occupations and retiring, also known as the “Great Resignation.” Along with the healthcare industry, tech saw some of the highest quit and turnover rates as the labor market grew more competitive from 2020 to 2021 [1]. These jobs saw extreme increases in demand at the onset of the pandemic, likely leading to increased workloads and burnout and pushing many workers to reconsider the field [1].
The contraction of tech occupations was not unique to Greater Philadelphia. Figure 3 compares the tech concentrations of the 15 largest U.S. metropolitan regions in 2021 and notes the rate of change since 2020.
FIGURE 3
SOURCE: Data were obtained from annual estimates of the 2020 and 2021 U.S. Bureau of Labor Statistics’ Occupational Employment Statistics (OES) program.
Of the 15 largest U.S. metropolitan regions, Greater Philadelphia had the tenth largest tech workforce in 2021 at 3.7 percent. Greater Seattle, Greater Washington D.C., and Greater San Francisco surpassed all other regions with tech concentrations over eight percent. These regions are major technology hubs with a multitude of large tech company headquarters as well as major tech users (such as the federal government in the case of Washington D.C.). Of the top 15 metros, every one other than Seattle, San Francisco, and Houston saw tech employment contraction after 2020.
With a 7.4 percent decline from 2020 to 2021, Greater Philadelphia saw the fourth highest retraction of its tech employment among the 15 largest U.S. metropolitan regions. Only Greater Atlanta, Greater Chicago, and Greater Detroit saw steeper rates of contraction.
Tech Employees' Residency
It remains difficult to measure how tech occupations are distributed across Greater Philadelphia. Federal occupational data largely stops at the metropolitan level, industry-level estimates can be faulty since tech permeates multiple industries, and proprietary job posting data is expensive and often does not detail how tech occupations are aggregated. The U.S. Census’ American Community Survey does, however, estimate “Computer and Mathematical” employment residency (i.e., where tech employees are predominantly living) [2]. While residency is a poor substitute for estimating tech job concentrations, it offers insight into where tech employees prefer to live in proximity to their work. Figure 4 maps both the concentration of tech employees’ residency as well as raw estimates.
FIGURE 4
SOURCE: Data were obtained from five-year estimates of the U.S. Census Bureau’s 2020 American Community Survey. The tech workforce is operationalized as any 16 years or older resident in the geographic area employed in a “Computer and Mathematical” Occupation.
The highest concentrations of Greater Philadelphia’s tech workforce by residency are in the suburbs. Only 2.6 percent of Philadelphia’s residential workforce was employed in computer and mathematical occupations in 2020. At 5.9 percent, the largest percentage of resident tech workers in the region in 2020 could be found in Chester County. When looking at raw estimates, Montgomery County claimed the highest count of resident tech workers at 21,625 in 2020; this is roughly 3,000 more tech workers than Philadelphia despite Montgomery County only having half the total residential population of the city [2]. With large suburban employers, such as Microsoft, Lockheed Martin, GlaxoSmithKline, DuPont, Vanguard, and Boeing, hiring a large proportion of the region’s tech workers out in suburban job centers like King of Prussia and Malvern, it comes as no surprise that many of the region's tech workers reside in the suburbs.
Philadelphia’s Tech Scene
As noted in previous Leading Indicators, Greater Philadelphia’s tech workforce played a modest role in anchoring the local economy at the onset of the pandemic. These workers proved essential as firms switched to remote work. But the increasing demands placed on tech workers took a toll as many switched or left their roles a year into the pandemic. Firms that rely on tech workers will need to deal with the demands of a tight labor market by improving working conditions, focusing on health and wellness, providing upskilling and career mobility, and dealing with the preferences of many of these workers for high degrees of flexibility and remote work. Whether we are witnessing an anomalous period or the beginning of a structural shift in the tech labor market remains to be seen.
Works Cited
[1] Cook, Ian. 2021. “Who Is Driving the Great Resignation?” Harvard Business Review, 15 September. Retrieved from: (https://hbr.org/2021/09/who-is-driving-the-great-resignation?pStoreID=epp?jumpid=ps_wwsupplies).
[2] U.S. Census Bureau. 2022. 2016-2020 American Community Survey 5-Year Estimates. Retrieved from: (https://www.census.gov/data.html).