Philadelphia’s Economic Competitiveness – PART 4: City to City Business Growth
In this brief, we complete our baseline comparison of Philadelphia’s economic competitiveness. This piece (along with the preceding three issues) will serve as a jumping-off point for examining the factors that influence Philadelphia’s ability to develop and attract new businesses, grow existing businesses, and increase high quality career-building employment opportunities for all manner of workers. With further insight, data, and simple analytics we aim to untangle the myriad of factors contributing to longstanding socioeconomic barriers that inhibit the growth of an inclusive and equitable regional economy. In this issue we compare private business growth in Philadelphia and its peer core cities in the 15 largest U.S. metropolitan regions.
Key Takeaways
- With just under 135,000 private business establishments in 2018, Philadelphia ranked third lowest among the core cities in the 15 largest U.S. metropolitan regions.
- When normalizing business counts by population, Philadelphia has the lowest number of businesses among the 15 peer cities – 127 private establishments for every 1,000 working-age residents.
- However, with six consecutive years of growth, the number of businesses in Philadelphia in 2018 was almost 30 percent greater than it had been in 2012. The city’s average annual growth rate from 2012 to 2018 (4.3 percent) was more than double the national average and surpassed all other cities’ growth rates - except Miami which saw a growth rate of 5.7 percent.
- At 22.4 percent in 2018, Philadelphia’s central city business concentration was the fourth lowest among the 15 peer cities. With a 2.03 percent growth rate between 2012 and 2018, this concentration saw the highest growth among the 15 peer cities.
- When comparing businesses estimates by employment size among the 15 peer cities in 2018, Philadelphia was the third lowest in its count of small and non-employer establishments (0-99 employees), had the lowest count of medium-sized establishments (100-499 employees), and the second lowest count of large establishments (500+ employees) – only outpacing Washington D.C.
- However, from 2012 to 2018, the growth of Philadelphia’s small and non-employer business establishments outpaced all peer cities except Miami.
- Growth of medium-sized establishments for Philadelphia was at the bottom of the pack; there were only 6.2 percent more medium-sized establishments in Philadelphia in 2018 than there had been in 2012. Peer cities saw at least a 10 percent increase in medium-sized establishments during this same period.
- In large establishment growth, Philadelphia was in the middle of the pack, seeing a 15.2 percent increase in large establishments between 2012 and 2018 – outpacing cities like Dallas, Washington D.C, Chicago, Houston, Los Angeles, Boston, and Minneapolis.
- At 4.4 percent, Philadelphia’s average annual growth rate of small businesses between 2012 and 2018 was the second highest of the 15 peer cities. This growth rate translates to the addition of roughly 5,000 small or non-employer establishments per year between 2012 and 2018.
- In mid-size business growth, Philadelphia ranked last compared to its peer cities with an average annual growth rate of 1.1 percent between 2012 and 2018.
- When it comes to average annual growth of large businesses, Philadelphia ranks in the middle of the pack of peer cities with a growth rate of 2.5 percent, falling just under the national average of 2.7 percent.
Overall Business Growth
The number of businesses in Philadelphia lags many of its peer cities. Figures 1 and 2 depict the number of private business establishments in the core city of each of the 15 largest U.S. metropolitan regions - with figure 1 detailing a raw count of businesses in 2018 while figure 2 normalizes those counts per 1000 working-age residents, those aged between 16 and 64 years old, in each city (using each core county as a proxy measure for each city).
Figure 1 shows that Philadelphia recorded the third lowest estimate of private business establishments in 2018, even though it hosts a much larger resident population than most of its peer cities – excluding New York City, Los Angeles, Chicago, Houston, and Phoenix. Only Boston and Washington D.C. had lower business establishment estimates in 2018. When normalized for every 1000 working-age residents, Philadelphia had the lowest count of businesses among the 15 peer cities – with 127 private establishments for every 1000 working-age residents in 2018. While this normalization is not an ideal measure for business vitality and employment, it does provide a rough evaluative measure to compare Philadelphia’s business environment with larger and smaller cities. If Philadelphia’s business count per 1000 working-age residents compared more evenly with larger cities like New York City or Los Angeles, we would know that our smaller city is remaining as competitive as these much larger cities. Since the data show that Philadelphia is not even keeping pace with much smaller cities, like Detroit, Boston, Seattle, and Minneapolis, we know that Philadelphia’s business environment is far less competitive than its smaller-sized peers.
FIGURE 1
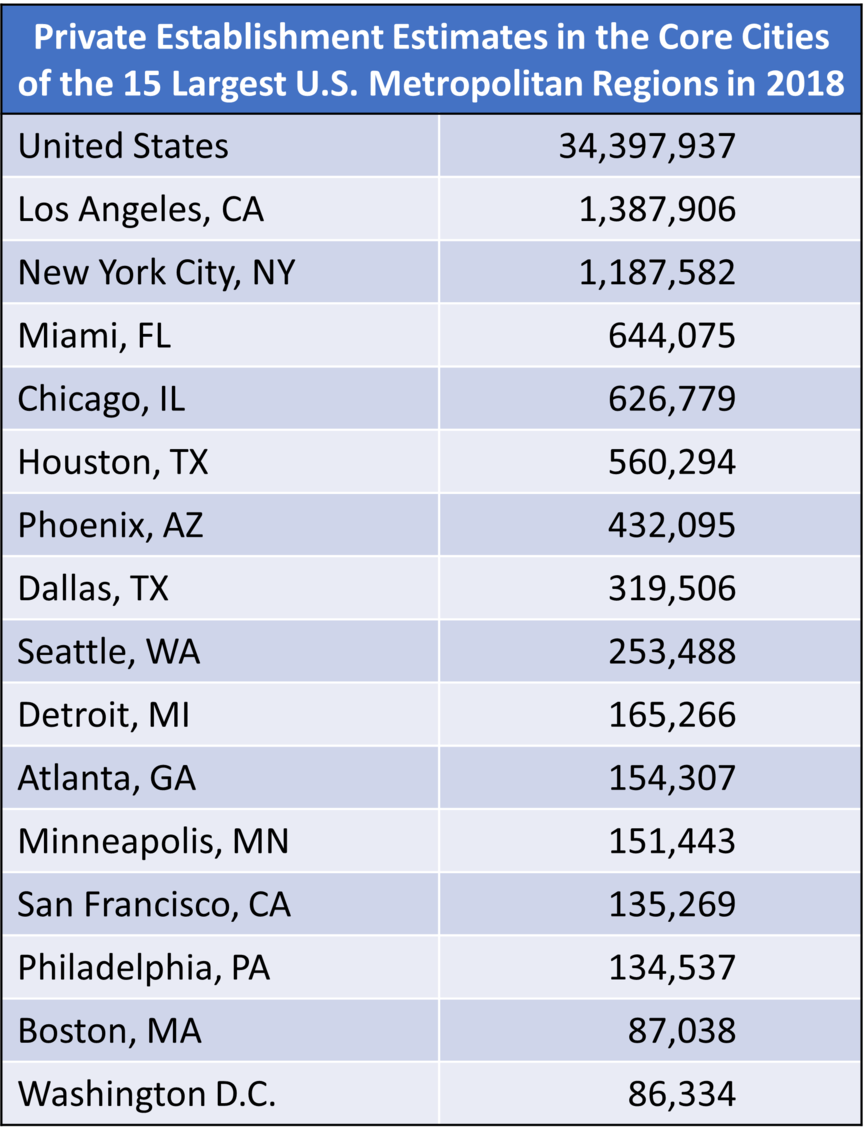
SOURCE: U.S. Census Bureau’s 2018 County Business Pattern estimates combined with 2018 Non-Employer Statistics estimates (the most recently available estimates). Each city is a proxy measure of the central county that contains each city (or counties in the case of New York City).
FIGURE 2
SOURCE: U.S. Census Bureau’s 2018 County Business Pattern estimates combined with 2018 Non-Employer Statistics estimates (the most recently available estimates). Area estimates were obtained from U.S. Census Bureau’s Gazetteer Files.
While the raw count of private establishments in Philadelphia remains small in comparison with its peers, the city saw significant growth in private establishments prior to the COVID-19 pandemic. Figure 3 shows the indexed growth of private establishments for the core cities of the 15 largest U.S. metropolitan regions from 2012 to 2018, while figure 4 details the average annual growth rates of businesses for each city over the same period. With six years of continual growth, the number of businesses in Philadelphia increased by almost 30 percent between 2012 and 2018 - more than twice the national average and surpassing all other peer cities except Miami. In fact, Philadelphia’s business growth closely resembled that of Boston during the same period. Philadelphia’s average annual growth rate also shows how well businesses grew during the six years in comparison with its peers. Like in figure 3, figure 4 illustrates how Philadelphia’s average annual growth rate of 4.3 percent was second only to Miami’s 5.7 percent growth rate.
FIGURE 3
SOURCE: U.S. Census Bureau’s 2012 through 2018 County Business Pattern estimates combined with 2012 through 2018 Non-Employer Statistics estimates (the most recently available estimates).
FIGURE 4
SOURCE: U.S. Census Bureau’s 2012 through 2018 County Business Pattern estimates combined with 2012 through 2018 Non-Employer Statistics estimates (the most recently available estimates).
Figure 5 compares the concentration of private businesses within each core city as a percentage of the total count of metropolitan businesses in 2018. In figure 5, both stories of Philadelphia’s overall small business count but significant growth are present. At 22.4 percent in 2018, Philadelphia’s proportion of central city businesses as a share of its total metropolitan business estimate was the fourth lowest among its 14 peer cities. Only Washington D.C, Boston, and Atlanta recorded lower central city business concentrations. Philadelphia, however, saw the highest growth in its central city business concentration from 2012 to 2018 at 2.03 percent - 1.4 times the growth rate of Boston, the city with the second highest growth rate. This further illustrates Philadelphia’s central role as the economic engine of its metropolitan region.
FIGURE 5
SOURCE: U.S. Census Bureau’s 2012 through 2018 County Business Pattern estimates combined with 2012 through 2018 Non-Employer Statistics estimates (the most recently available estimates).
Business Growth by Employment Size
As with our previous analysis—comparing business growth between Philadelphia and its surrounding suburban counties—disaggregating business growth by employment size can demonstrate how well an area is attracting major employers as well as the strength of its start-up and small business ecosystem.
Figure 6 details the share of small, medium, and large private employer establishments within the core cities of the 15 largest U.S. metropolitan regions in 2018. Using Pew’s previous categorization of small and midsize businesses, we define large establishments as those with 500 or more employees, medium establishments as those with 100 to 499 employees, and small establishments as those with 0 to 99 since they include non-employer or self-owned businesses. Across each city, the distribution of large, medium, and small private establishments is roughly the same, with small and non-employer establishments comprising roughly 99 percent of each area’s business ecosystem, medium establishments ranging from roughly half a percent to one percent, and large establishments barely surpassing one tenth of a percent.
FIGURE 6
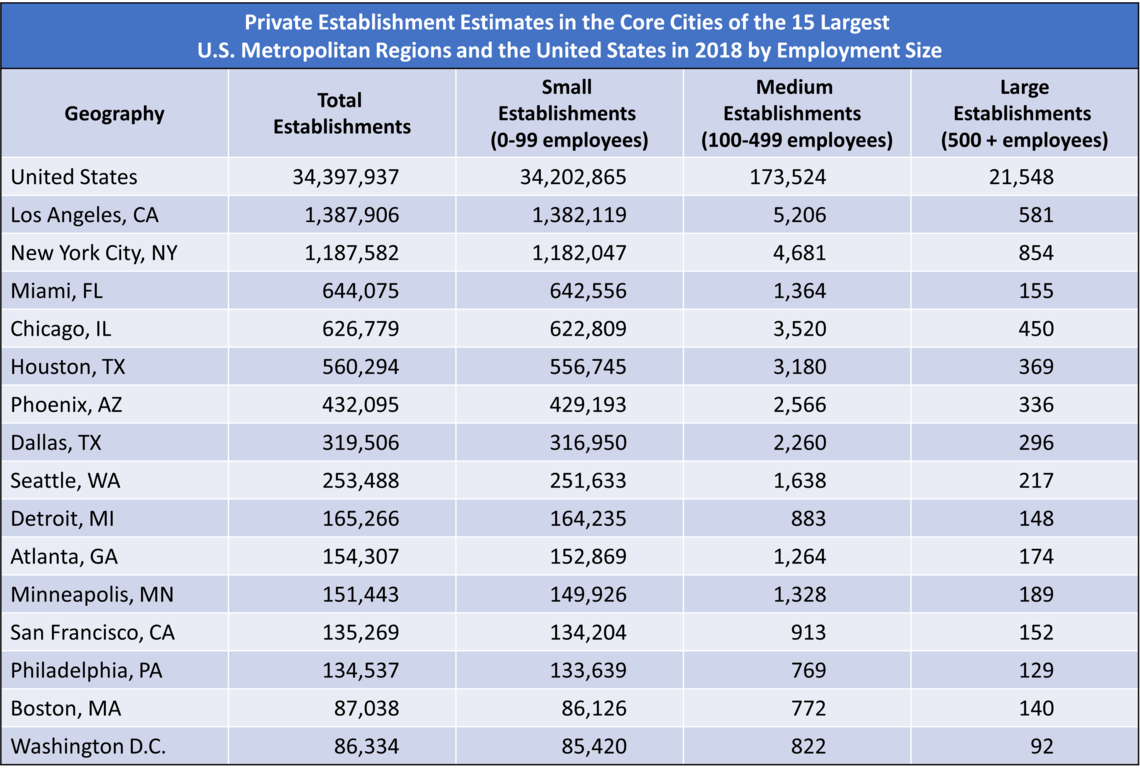
SOURCE: U.S. Census Bureau’s 2018 County Business Pattern estimates combined with 2018 Non-Employer Statistics estimates (the most recently available estimates).
As with its total business estimate in 2018, Philadelphia’s disaggregated business estimates by employment size also place it largely behind its peers. It had the third lowest count of small and non-employer establishments, the lowest count of medium-sized establishments, and the second lowest count of large establishments - only outpacing Washington D.C.
Figure 7 details the indexed growth of each type of private employer establishment in the core cities from 2012 to 2018. Philadelphia's growth rate for small and non-employer establishments outpaced those of all its peer cities - except Miami. This is unsurprising, considering how small and non-employer establishments make up the bulk of each city’s overall business growth trends (see Figure 3). In medium establishment growth, Philadelphia fell to the bottom of the pack with a medium establishment estimate in 2018 only 6.2 percent greater than in 2012. Most cities saw at least a 10 percent increase in medium establishments between 2012 and 2018. Philadelphia was also the only city to see a decline in medium establishments (from 2012 to 2014); no other city saw decline in medium establishments during the six-year period. In large establishment growth, Philadelphia stayed in the middle of the pack; seeing 15.2 percent increase in large establishments between 2012 and 2018 and outpacing cities like Dallas, Washington D.C, Chicago, Houston, Los Angeles, Boston, and Minneapolis. Philadelphia did, however, trail the national average growth in large establishments – closing the gap by 2018.
FIGURE 7
SOURCE: U.S. Census Bureau’s 2012 through 2018 County Business Pattern estimates combined with 2012 through 2018 Non-Employer Statistics estimates (the most recently available estimates).
Figure 8 shows the average annual growth rate of private establishments by employment size from 2012 to 2018 among the core cities. As in figure 7, figure 8 shows that the average annual growth rate of small businesses in Philadelphia was higher than its peer cities, except for Miami. Philadelphia’s small business growth rate of 4.4 percent roughly translates to the addition of 5,000 small or non-employer establishments per year between 2012 and 2018. In mid-size business growth, Philadelphia ranked last compared to its peer cities with an average annual growth rate of 1.1 percent - more than half a percentage lower than the next city of Minneapolis. This is unsurprising given that Philadelphia was the only city to see a decline in medium establishments from 2012 to 2014. When it comes to average annual growth in large businesses, however, Philadelphia fares much better and ranked in the middle of the pack with a growth rate of 2.5 percent, falling just under the national average of 2.7 percent. Cities like San Francisco, Phoenix, and Detroit, on the other hand, saw much larger growth rates in large businesses during the same six-year period.
FIGURE 8
SOURCE: U.S. Census Bureau’s 2012 through 2018 County Business Pattern estimates combined with 2012 through 2018 Non-Employer Statistics estimates (the most recently available estimates).
A Baseline Conclusion
In this series, we tested measures of Philadelphia’s economic competitiveness with both its surrounding suburban counties and peer U.S. cities. From our assessment we have found both bright spots and challenges that will need further examination.
Foremost among these findings is that Philadelphia serves as the economic engine of its own metropolitan region. Across measures of employment, pay, and business growth, the city largely outperforms its surrounding suburban counties. This may reflect the greater concentration of economic opportunities for workers, entrepreneurs, investors, and business owners in the city. With the higher concentration of education, health, civic, cultural, and financial institutions along with greater flows of capital, the city has the capacity to draw more talent and funds to fuel its economy. Paralleling this concentration of talent and opportunity, however, is a longstanding legacy concentration of unemployment and poverty - largely impacting historically excluded Black and Brown populations. A greater focus on upending the underlying contributors to low labor force participation, poverty, and crime will be key economic strategies that will strengthen the city’s economic centrality in the region.
Compared to its peer cities, Philadelphia is less economically competitive. It offers fewer employment opportunities and retains a much smaller business ecosystem than many of its peers. Trends seem to be moving in a positive direction, however. Wages are rising faster than in many peer cities, and Philadelphia seems to outpace many peers in small business growth. But these bright spots are further evidence of a “slow-growth” economy, and the COVID-19 pandemic also seems to have reversed much of the “slow-growth” success of the previous decade. Understanding how to return to the previous growth trajectory with a greater emphasis on equity and inclusion, as well as identifying the barriers to quality employment and larger business growth, will be the key to Philadelphia’s economic recovery and future successes.