Philadelphia’s Looming Housing Affordability Crisis – Part 3
In our last Leading Indicator, we compared Philadelphia’s housing affordability with other similarly sized U.S. cities and the nation. For this issue, we take a closer look at how Philadelphia’s housing affordability differs among different racial and ethnic residential populations.
Key Takeaways
- As of 2019, the home-price-to-income ratio for Philadelphia’s Latinx and Black populations stood at 5.6 and 5.0, respectively; meaning it would take over five years of income for at least 50 percent of these populations to afford the city’s median home value. A ratio above 2.6 is generally considered to be ‘housing burdened.’
- The price-to-income ratio for Philadelphia's Asian population saw steady decline from 2011 to 2018, and it has remained relatively close to the city’s average since 2013.
- Only the city’s Non-Hispanic White population saw a price-to-income ratio below 3.0 between 2005 and 2019.
- At 39.9 percent in 2019, the Latinx population had the highest share-of-rent percentage –or highest percentage of income being utilized for rent. A rent share threshold of 30 percent or above is considered ‘rent burdened’ or an over utilization of income for rent.
- Share-of-rent was above 30 percent for the city’s Latinx and Black populations during the entire period between 2005 and 2019.
Comparison of Housing Affordability Among Racial and Ethnic Groups
In previous Leading Indicators we examined Philadelphia’s housing affordability over the past fifteen years and compared its affordability with similarly sized cities. We know, however, that deep-seated structural inequalities within the labor force and housing market differentiate housing affordability for different racial and ethnic groups living in the city. To illustrate the differences in affordability, Figure 1 compares the median household income, owner-occupancy rate, and renter-occupancy rate among the major racial and ethnic groups in Philadelphia.
FIGURE 1
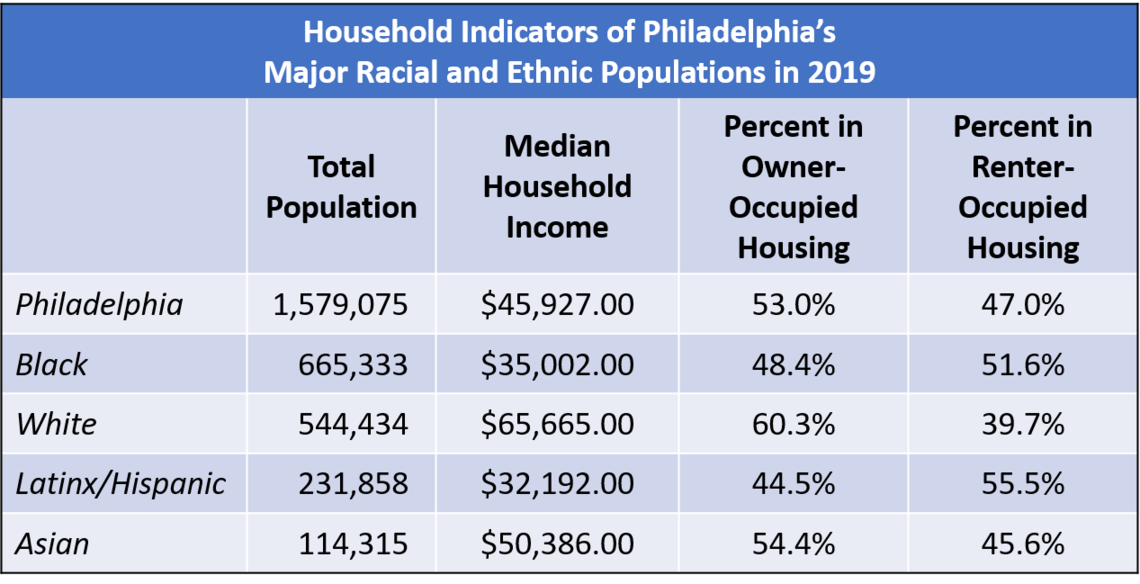
SOURCE: Data were obtained from five-year estimates of the U.S. Census Bureau’s 2019 American Community Survey.
Figure 1 demonstrates that higher median household incomes correlate with higher rates of homeownership. While the city’s overall median household income in 2019 was $45,927, for Non-Hispanic Whites it was $65,665 or 1.4 times greater than city’s average. Non-Hispanic Whites also had the highest owner-occupancy rate among the major racial and ethnic groups at 60.3 percent – 7.3 percent higher than the city’s average. Philadelphia’s Asian population had the second highest median household income at $50,386 in 2019, and predictably, the second highest owner-occupancy rate at 54.4 percent – slightly above the city’s average. The city’s Black and Latinx households saw median household incomes that were roughly 75 and 70 percent that of the city’s median household income in 2019, respectively. These groups were also more likely to rent than own; 51.6 of Black households and 55.5 percent of Latinx households were renter occupied. With the lowest median household income of a major racial or ethnic group, at $32,192, the city’s Latinx population had a renter-occupancy rate 1.2 times greater than the city’s average and 1.4 times greater than the city’s Non-Hispanic White population.
Comparing Price-to-Income Ratios
To better understand the differences in housing affordability among Philadelphia’s racial and ethnic residential populations, Figure 2 compares the city’s home-price-to-income-ratio across residential populations from 2005 to 2019. As previously discussed, the price-to-income ratio is the projected number of years of income it would take to afford a home; the standard price-to-income ratio utilized by the real estate industry for mortgage qualification is 2.6 years. Using this base affordability ratio in comparison with the ratio of the city’s median home value and median household income shows that 50 percent of Philadelphia’s households would be unable to afford a home over $123,000. The city’s median home value in 2019 was $183,000, thus it would take approximately 3.85 years of income for a resident at the median household income to afford the median home value in Philadelphia.

FIGURE 2
SOURCE: Data were obtained from one-year estimates of the U.S. Census Bureau’s 2005 through 2019 American Community Survey.
NOTE: Sampling errors occurred in the 2017 American Community Survey in Philadelphia. All 2017 Philadelphia estimates should be interpreted with caution.
As of 2019, the home-price-to-income ratio for Philadelphia’s Latinx and Black populations stood at 5.6 and 5.0, respectively – meaning it would take over five years of income for at least 50 percent of these populations to afford the city’s median home value. The price-to-income ratios for Philadelphia’s Asian and Non-Hispanic White populations were below the city’s average price-to-income ratio in 2019. Interestingly, the price-to-income ratio for Philadelphia’s Asian population saw steady decline from 2011 to 2018. It has remained relatively close to the city’s average since at least 2013. In 2019, the price-to-income ratio for the city’s Non-Hispanic White population was exactly 2.6 – the standard affordability ratio. Between 2005 and 2019 the price-to-income ratio for the city’s white population remained relatively close to the 2.6 ratio – only pushing above 3.0 during the Great Recession. In fact, only the city’s Non-Hispanic White population saw a price-to-income ratio below 3.0 between 2005 and 2019.
Comparing the Cost of Rent
When looking at rent, Black and Brown Philadelphians are more likely to be rent burdened than other racial groups. Figure 3 calculates annual rent as percentage of each racial and ethnic group’s median household income from 2005 to 2019. Like the price-to-income ratio, this share-of-rent percentage gauges the proportion of annual income needed to afford rent in Philadelphia. Included in Figure 3 is a dashed line to represent standard rent burden at 30 percent of income, generally considered to be the upper bound of rent affordability [1]. At 39.9 percent in 2019, the Latinx population had the highest rent share in the city, while the Black population was a close second at 35.4 percent. Rent shares for both groups were significantly higher than the city’s average rent share of 27.3 percent. This trend has remined constant for the entire period between 2005 and 2019; neither group saw a rent share below 30 percent for the entire fifteen years. The rent share for Philadelphia’s Asian population hovered around the city’s average and fell to 26.3 percent in 2019. The share-of-rent percentage for the Non-Hispanic White population was at 18.5 percent in 2019 – 8.8 percent below the city’s average.
FIGURE 3
SOURCE: Data were obtained from one-year estimates of the U.S. Census Bureau’s 2005 through 2019 American Community Survey.
NOTE: Sampling errors occurred in the 2017 American Community Survey in Philadelphia. All 2017 Philadelphia estimates should be interpreted with caution.
At the Neighborhood Level
While our analysis demonstrates how housing affordability falls along lines of race and ethnicity, it is true that many communities within the city live in neighborhoods that meet their financial and housing needs. In our next Leading Indicator, we will further examine housing affordability among Philadelphia’s neighborhoods to better understand both the bright spots and disparities in housing affordability within the city.
Works Cited
[1] The Pew Charitable Trusts. 2018. American Families Face a Growing Rent Burden. Retrieved from: (https://www.pewtrusts.org/en/research-and-analysis/reports/2018/04/american-families-face-a-growing-rent-burden).