Philadelphia’s Looming Housing Affordability Crisis – Part 2
In our last Leading Indicator, we detailed the growing gap between household incomes, home values, and rent in Philadelphia. For this issue, we take a closer look at how Philadelphia’s housing affordability compares with other similarly sized U.S. cities and the nation as a whole.
Key Takeaways
- Of the top ten largest U.S. cities, Philadelphia’s median home value and median gross rent are second lowest - just above San Antonio, Texas.
- As of 2019, the median home value in Philadelphia was about 76 percent of the U.S. median, while the median gross rent in Philadelphia was about 98 percent of the U.S. median.
- With a home-price-to-income ratio of 3.9 in 2019, Philadelphia’s ratio has been consistently greater than the U.S. average since 2009.
- At 51.9 percent in 2019, Philadelphia had the second highest rent-burdened population among the top ten largest cities in the U.S. – second only to Los Angeles, California.
- The proportion of Philadelphia’s population that is rent burdened has, on average, remained 4 percent higher than the nation’s average between 2005 and 2019.
A Comparison of Housing Affordability
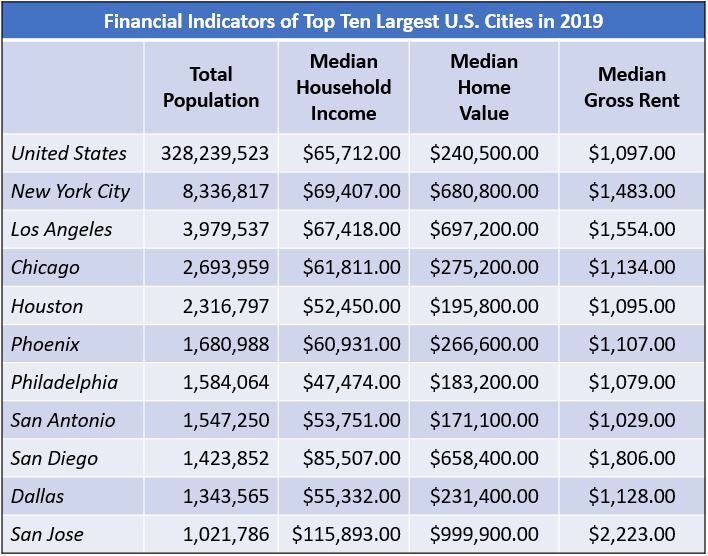
When comparing home values and rent across the ten largest U.S. cities, Philadelphia seems comparatively more affordable. Figure 1 displays the median home value, median gross rent, and median household income of the top ten largest U.S. cities in 2019. Of these cities, Philadelphia’s median home value and median gross rent are second lowest - just above San Antonio, Texas. In fact, Philadelphia’s median home value and rent are below the nation’s averages. The median home value in the U.S. is 1.3 times greater than in Philadelphia, while the nation’s median gross rent is almost $20.00 more expensive. While home values and rent are comparatively low, Philadelphia also has the lowest median household income of the top ten largest cities; underscoring the fact that it remains the poorest big city in the nation. The city’s median household income is slightly more than 70 percent of the nation’s and just over 40 percent of the wealthiest big city, San Jose, California. In short, while Philadelphia’s home values and rents are relatively low compared to peer cities, its low household income means that housing costs are still unaffordable for many residents.
FIGURE 1

SOURCE: Data were obtained from one-year estimates of the U.S. Census Bureau’s 2019 American Community Survey.
Comparing the Price to Income Ratios
To further understand the context of Philadelphia’s housing affordability, figure 2 compares the home-price-to-income ratio for each of the top ten U.S. cities from 2005 to 2019. As previously discussed, the price-to-income ratio represents how many years of income it would take to pay for a home [1]. The benchmark price-to-income ratio used by the real estate industry for mortgage qualification is 2.6 – that is, a household is expected to be able to afford a home equal to approximately 2.6 years of income [1]. The dashed line in figure 2 represents this 2.6 “affordability margin.” The more the price-to-income ratio exceeds this 2.6 margin, the greater the degree of housing unaffordability.

FIGURE 2
SOURCE: Data were obtained from one-year estimates of the U.S. Census Bureau’s 2005 through 2019 American Community Survey.
NOTE: Sampling errors occurred in the 2017 American Community Survey in Philadelphia. All 2017 Philadelphia estimates should be interpreted with caution.
As of 2019, only Houston and San Antonio had lower price-to-income ratios than Philadelphia. In fact, Philadelphia’s price-to-income ratio maintained a consistent position within the bottom five cities from 2005 to 2019, moving up to the fifth highest position only during the Great Recession. Philadelphia’s price-to-income ratio has, however, been above the U.S. average since 2009 (excluding the estimate from 2017 because of a sampling error). Los Angeles, New York City, San Jose, and San Diego far outpaced all other cities’ ratios for the entire period between 2005 and 2019. In fact, Los Angeles’ 2019 price-to-income ratio stood at 2.8 times the national average and 2.6 times greater than Philadelphia’s. Only Chicago saw its price-to-income ratio decline since 2005, while Dallas, Houston, San Antonio, and Phoenix are more recently exhibiting growing trends of unaffordability. But by 2019, no city had a price-to-income ratio at or below the 2.6 margin of affordability.
Comparing the Rent Gap
While Philadelphia’s home prices and price-to-income ratio remain relatively lower than the other ten largest U.S. cities, its rent burden is comparatively high. As discussed in our last Leading Indicator, rent burden measures the number of renter-occupied units spending 30 percent or more of their income on rent alone. Figure 3 demonstrates Philadelphia’s comparatively high rent burden within the top ten largest U.S. cities. At 51.9 percent in 2019, Philadelphia had the second highest rent burdened population, second only to Los Angeles, California. In fact, Philadelphia’s rent burdened population has, on average, remained 4 percent greater than the nation’s average between 2005 and 2019. Only the cities in the Southwest have remained close to the U.S. average during the 15-year period.
FIGURE 3
SOURCE: Data were obtained from one-year estimates of the U.S. Census Bureau’s 2005 through 2019 American Community Survey.
NOTE: Sampling errors occurred in the 2017 American Community Survey in Philadelphia. All 2017 Philadelphia estimates should be interpreted with caution.
Continuing the Analysis
With falling rates of homeownership and a growing rental population, Philadelphia’s relatively high rent burden among the largest U.S. cities is cause for concern. In our next Leading Indicator, we will dive deeper into the rent burden across residential populations within the city.
Works Cited:
[1] Florida, Richard. 2018. “Where the House-Price-to-Income Ratio Is Most Out of Whack.” CityLab, 29 May. Retrieved from: (https://www.bloomberg.com/news/articles/2018-05-29/how-many-years-of-income-does-a-home-in-your-city-cost).