Philadelphia’s Persistent Income Inequality: A 2019 Data Update
Aligned with the Economy League’s mission to promote equity and shared prosperity in Greater Philadelphia, we continue our coverage of income inequality in Philadelphia using updated estimates from the U.S. Census Bureau.
Key Takeaways:
- Black households made up 55.8 percent of all households earning less than $10,000 a year in 2019, more than twice the rate of white households - the next largest group.
- Philadelphia’s Latinx full-time workers continue to earn the least among Philadelphia’s racial and ethnic groups, with Latinos and Latinas making $0.57 and $0.50 respectively to every white male dollar earned.
- While Philadelphia’s Asian men and women have seen significant gains in earnings since 2010, they still fall behind estimates from many peer cities and the U.S.
- At $0.64 and $0.61, respectively, the proportional earnings for Black men and women in Philadelphia fare better than other peer cities along the I-95 corridor.
- While wage gaps in Philadelphia are relatively smaller compared to peer cities and the U.S, it is still rare to see any group earn more than $0.75 for every white male dollar.
Household Income Inequality by Race and Ethnicity
With the City's recent allocation of $10 million to the United Way of Greater Philadelphia and Southern New Jersey to spearhead the city’s Poverty Action Plan, the Economy League continues to highlight pertinent data on poverty and inequality to better inform these efforts. As we have detailed in past Leading Indicator data briefs and our Color of Inequality special series, the legacy of structural racism has disproportionately inhibited communities of color from building sustainable career pathways and generational wealth. Employment opportunities and wealth creation have been demonstrably inequitably distributed across racial and ethnic populations due to the long-term impacts of prejudice, financial redlining, housing segregation, unequal school funding, the digital divide, underfunded public transit, and over-policing. Figure 1 demonstrates the stark impact of structural racism on the distribution of income in Philadelphia across racial groups.
FIGURE 1
NOTE: Data were obtained from five-year estimates of the U.S. Census Bureau’s 2015-2019 American Community Survey. All racial groups include individuals of Latinx/Hispanic ethnicity.
Figure 1 illustrates that households of color in Philadelphia are disproportionately represented in lower income brackets relative to white households. Households of color made up 72.2 percent of households earning less than $10,000 a year in 2019 – 2.6 times the representation of white households in the same income bracket. At the other end of the spectrum, households of color made up only 22.9 percent of households earning $200,000 or more in 2019; white households’ representation is 3.4 times greater.
Black households made up 55.8 percent of all households earning less than $10,000 a year in 2019 which is over twice the representation of white households (the next largest group). With the city’s median household income at roughly $46,000 in 2019, a Black household was 1.6 times more likely to be making less than $40,000 in 2019 than a white household [1]. Similarly, the highest concentrations of multi-racial households and households identifying as “other” along with Native American and Polynesian households can also be found in the lowest income brackets. Only Asian households seem to be evenly dispersed among income brackets, with the highest concentration of 7.9 percent earning between $150,000 and $200,000. Philadelphia’s white households represent a majority in all income brackets earning $40,000 or more. Since our previous analysis of 2018 estimates, the percentage of white households earning $75,000 or more has slightly increased while the concentration of Black households in the $75,000 to $150,000 and $200,000 or more income brackets has also slightly increased.
Like other communities of color within the city, Figure 2 shows that households of Latinx/Hispanic descent are highly represented among lower income brackets. The lowest income bracket has the highest representation of Latinx/Hispanic households at 15.3 percent. This proportion has increased by 0.4 percent since our previous analysis of 2018 estimates.
FIGURE 2
NOTE: Data were obtained from five-year estimates of the U.S. Census Bureau’s 2015-2019 American Community Survey.
Though the simple measure of income inequality across households fails to account for differences in occupations, employment status, and age, analyzing overall income inequality among households provides a full picture of unequal outcomes among Philadelphia’s workforce. These trends demonstrate a legacy of structural racism that has led to an overrepresentation of people of color in poverty.
Philadelphia’s White Male Dollar
We also compared the relative earnings of Philadelphia’s full-time salaried workforce across categories of race, ethnicity, and gender, using the white male dollar as a base [2]. Figure 3 shows that large wage gaps persist for women and persons of color when compared to white males in the city.
FIGURE 3
NOTE: Data were obtained from one-year estimates of the U.S. Census Bureau’s 2010 through 2019 American Community Survey. All racial groups (excluding white males and females) include individuals of Latinx/Hispanic ethnicity.
Consistent with our previous analysis, the 2019 estimates show that both Black and Brown full-time salaried workers in Philadelphia continue to follow a downward trend in earnings from 2010 to 2019. The 2019 figures report the lowest proportional earnings during this time period for full-time salaried Black and Latina women at $0.61 and $0.50 respectively. White women in Philadelphia seem to have fared better: 2019 saw the highest proportional earnings since 2010 (when earnings in 2017 are excluded because of sampling errors). Asian full-time salaried workers, on the other hand, saw a slight decline in 2019 after significant growth since at least 2016.
Figure 4 compares the relative earnings of Philadelphia’s full-time salaried workforce with those in the U.S. and among the peer cities of Boston, New York City, Baltimore, and Washington D.C. and found relatively consistent patterns of stratified earnings by race, ethnicity, and gender. Like Philadelphia, most full-time workers of color and women across the U.S. and within peer cities are seeing disproportionate earnings when compared to white men.
FIGURE 4
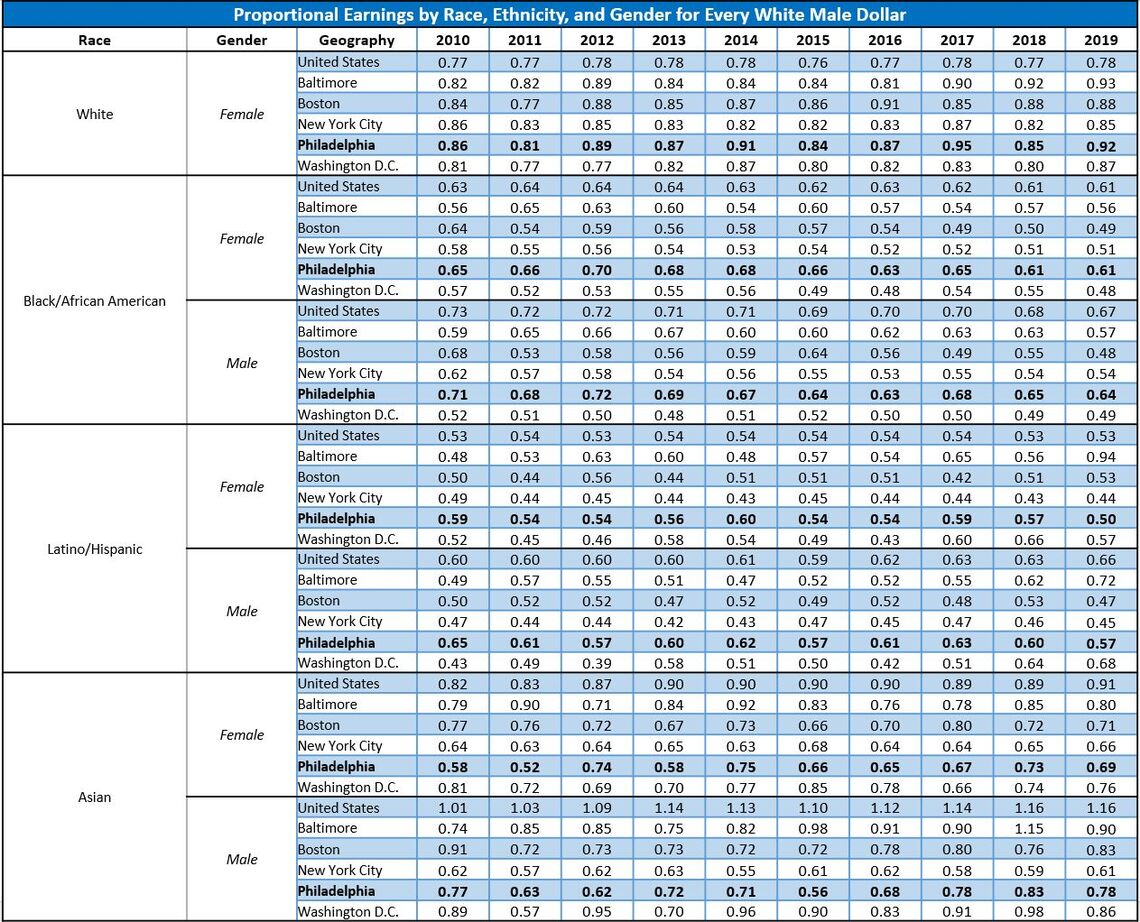
NOTE: Data were obtained from one-year estimates of the U.S. Census Bureau’s 2010 through 2019 American Community Survey. All racial groups (excluding white males and females) include individuals of Latinx/Hispanic ethnicity. The proportional earnings were calculated from annual median earnings of full-time, salaried workers. Philadelphia’s 2017 estimates were calculated with sampling errors; these estimates should be interpreted with caution.
Figure 4 suggests that Philadelphia’s wage gaps remain relatively consistent with the U.S. and peer cities. Typically, people of color fare worse than white populations. Yet wage gaps among men and women remain relatively close - except for white females who make on average $0.86 for every male dollar earned in Philadelphia or its peer cities.
Proportional earnings for Philadelphia’s Black women remain on par with the nation and is the highest among the peer cities at $0.61 per white male dollar. Philadelphia’s Black men seem to fare better than populations in other peer cities. In fact, Philadelphia’s Black men had the smallest reported wage gap among peer cities in 2019 but remained three cents below the national estimate. Only white women in Baltimore report higher proportional earnings than Philadelphia's white women. Latinos, Latinas, and Asian workers seem to fare worse in Philadelphia (but better than in New York City).
Regardless of some small gains, the data show that neither Black nor Latinx workers in Philadelphia and across the Eastern Seaboard ever earn more than $0.70 for every white male dollar. It remains to be seen whether the country’s renewed focus on racial inequity will translate into earnings.
Works Cited
[1] U.S. Census Bureau. 2019. 2014-2018 American Community Survey 5-Year Estimates. Retrieved from: (https://www.census.gov/data.html).
[2] Alexia Fernández Campbell. 2016. “Privilege Helps Men—but Not Women—Get Fancy Jobs.” The Atlantic, October 18. Retrieved from: (https://www.theatlantic.com/business/archive/2016/10/privilege-helps-me…).