Income Inequality among Philadelphia’s Workforce: An Update
In May 2019 we examined income inequality by race, ethnicity, and gender among Philadelphia’s workforce. In this Leading Indicator, we revisit these measures to benchmark the city’s progress towards racial and gender equality in pay.
Key Takeaways:
- Philadelphia's Black households continue to be overrepresented among income brackets making less than $40,000 a year, even though Black residents make up the majority of the city’s population.
- Philadelphia’s Latinx full-time workers continue to earn the least among Philadelphia’s racial and ethnic groups, with Latinos and Latinas making $0.60 and $0.57 respectively to every white male dollar earned.
- While Philadelphia’s Asian men and women have seen significant gains in earnings since 2010, they still fall behind estimates from many peer cities and the U.S.
- While wage gaps in Philadelphia are relatively smaller compared to peer cities and the U.S, it is still rare to see any group earn more than $0.75 for every white male dollar.
Household Income Inequalities by Race and Ethnicity
As we have shown in previous Leading Indicators and our Color of Inequality series, income inequalities across racial and ethnic groups are in large part the result of structural challenges people of color face when connecting to employment opportunities. Educational attainment, the digital divide, lack of access to reliable transportation, and barriers associated with a criminal record all disproportionately affect workers of color from building sustainable career pathways that build household and generational wealth. Figure 1 demonstrates how these barriers result in stark differences across income brackets for Philadelphia’s racial groups.
FIGURE 1
NOTE: Data were obtained from five-year estimates of the U.S. Census Bureau’s 2014-2018 American Community Survey. All racial groups include individuals of Latinx/Hispanic ethnicity.
Figure 1 illustrates that more households of color in Philadelphia occupy lower income brackets than white households. Black households make up 55.6 percent of all households earning less than $10,000 a year which is 1.8 times the representation of white households. With the city’s median household income averaging around $44,000 in 2018, a Black household is 1.5 times more likely to be making less than $40,000 than a white household [1]. Similarly, the highest concentrations of multi-racial households and households identifying as “other” along with Native American and Polynesian households can also be found in the lowest income brackets. Only Asian households seem to be evenly dispersed among income brackets; with the highest concentration of 7.9 percent earning between $150,000 and $200,000. White households, on the other hand, show the greatest representation in the highest income brackets with a 76.8 percent representation among households earning $200,000 or more. Philadelphia’s white households represent a majority in all income brackets earning $40,000 or more. In comparison with our previous analysis, while the percentage of white households earning $200,000 or more has not changed, the estimate of Black households earning less than $10,000 a year has increased by 4 percent between 2017 and 2018 (although some of this may reflect sampling errors from the 2017 wave of the American Community Survey).
The distribution of income equality among households of different ethnicities has seen few changes since 2017. Figure 2 shows how households of Latinx/Hispanic descent are highly represented among the city’s lower income brackets. In fact, the lowest income bracket has the highest representation of Latinx/Hispanic households at 14.9 percent. This proportion has not changed between 2017 and 2018.
FIGURE 2
NOTE: Data were obtained from five-year estimates of the U.S. Census Bureau’s 2014-2018 American Community Survey.
Though the simple measure of income inequality across households fails to account for differences in occupations, employment status, and age, analyzing overall income inequality among households provides a full picture of unequal opportunity among Philadelphia’s workforce. These trends demonstrate that there is an overrepresentation of people of color in poverty in this city because of white privilege and misappropriated opportunity.
Philadelphia’s White Male Dollar
In addition to our analysis of household income distribution, we compared the relative earnings of Philadelphia’s full-time salaried workforce across categories of race, ethnicity, and gender. Since white males have historically benefitted from privilege and opportunity across spheres of education, employment, mentorship, and networking, we compared proportional earnings across race, ethnicity, and gender for every white male dollar [2]. Figure 3 shows how large wage gaps persist for women and persons of color when compared to white males in the city.
FIGURE 3
NOTE: Data were obtained from one-year estimates of the U.S. Census Bureau’s 2010 through 2018 American Community Survey. All racial groups (excluding white males and females) include individuals of Latinx/Hispanic ethnicity.
Excluding the estimates from 2017 because of sampling errors, the trajectory of earnings for both Black and Brown full-time salaried workers seems to be following a downward trend from 2010 to 2018. Even white women in Philadelphia have seen a consistent drop in their earnings in the past few years (with 2014 seeing the highest recorded proportional earnings for white women when 2017 is excluded). Only Asian full-time salaried workers seem to have fared better in Philadelphia since 2010.
Figure 4 compares the relative earnings of Philadelphia’s full-time salaried workforce with those in the U.S. and among the peer cities of Boston, New York City, Baltimore, and Washington D.C. and found relatively consistent patterns of stratified earnings by race, ethnicity, and gender. Like Philadelphia, most full-time workers of color and women across the U.S. and within peer cities are seeing disproportionate earnings when compared to white men.
FIGURE 4
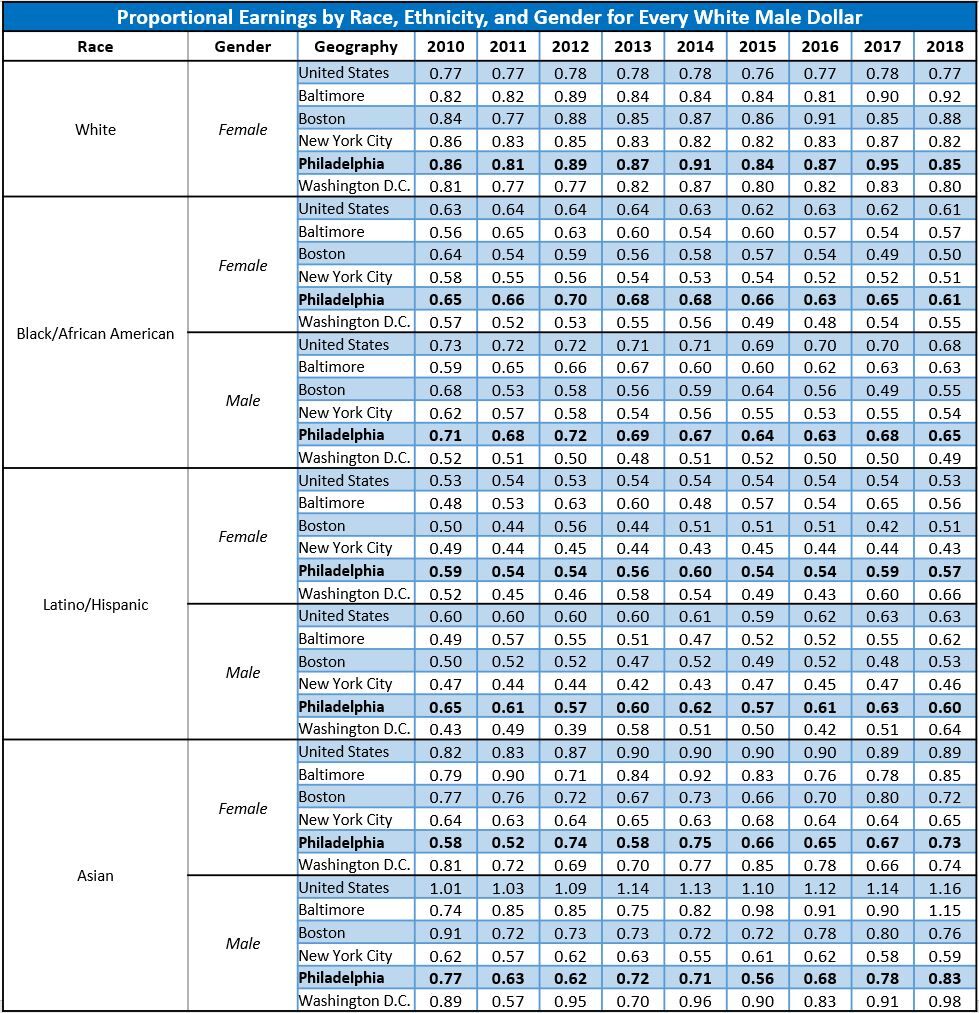
NOTE: Data were obtained from one-year estimates of the U.S. Census Bureau’s 2010 through 2018 American Community Survey. All racial groups (excluding white males and females) include individuals of Latinx/Hispanic ethnicity. The proportional earnings were calculated from annual median earnings of full-time, salaried workers. Philadelphia’s 2017 estimates were calculated with sampling errors; these estimates should be interpreted with caution.
Figure 4 suggests that Philadelphia’s wage gaps remain relatively consistent with the U.S. and peer cities. Typically, people of color fare worse than white populations. Yet wage gaps among men and women remain relatively close - except for white females who make on average $0.85 for every male dollar earned in Philadelphia or its peer cities.
Proportional earnings for Philadelphia’s Black women remain on par with the nation and is the highest among the peer cities at $0.61 per white male dollar. Philadelphia’s Black men, Latinas, and white women seem to fare better than populations in other peer cities. In fact, Philadelphia’s Black men had the smallest reported wage gap among peer cities in 2018 but remained three cents below the national estimate. Only Latinas in Washington D.C. seem to fare better than Philadelphia’s population, and white women in New York City and Boston report higher proportional earnings than Philadelphia's white women. Latinos and Asian men and women seem to fare worse in Philadelphia.
Regardless of some small gains, the data show that communities of color both in Philadelphia and across the Eastern Seaboard rarely earn more than $0.75 for every white male dollar. With renewed attention to racial justice and equity, the time seems right to address the barriers communities of color face when connecting to sustainable employment opportunities.
Works Cited
[1] U.S. Census Bureau. 2019. 2014-2018 American Community Survey 5-Year Estimates. Retrieved from: (https://www.census.gov/data.html).
[2] Alexia Fernández Campbell. 2016. “Privilege Helps Men—but Not Women—Get Fancy Jobs.” The Atlantic, October 18. Retrieved from: (https://www.theatlantic.com/business/archive/2016/10/privilege-helps-men-not-women-get-lucrative-jobs/504497/).