Philadelphia’s Millennial Population
From delaying marriage and homeownership to their role in progressive social movements, the millennial generation has received plenty of media attention in recent years for their impact on various economic, social, and political trends within the United States. One emerging trend among millennials, which has received less media attention, is the health challenges they face in comparison with older generations. According to Blue Cross Blue Shield’s 2019 Health of Millennials report and recent update on behavioral health conditions, millennials are seeing increased prevalence of chronic conditions, like hypertension and high cholesterol, and mental health conditions, like major depression and hyperactivity, when compared to older generations at their age [1].
Next week, the Economy League of Greater Philadelphia and Independence Blue Cross are launching the Well City Challenge – a social impact launchpad that will engage and support local entrepreneurs with promising ideas for addressing millennial health challenges in communities across the region. This initiative aims to heighten awareness of the health challenges millennials face and surface community-driven innovative solutions. A healthy economy requires healthy people. In anticipation of the Well City Challenge launch, this week’s Leading Indicator takes a closer look at Philadelphia’s millennial population to explore prevailing demographic and economic trends that interplay with their increased health challenges.
Key Takeaways
- Over one-third of Philadelphians are millennials. The approximately 528,000 millennials living in Philadelphia represent the largest generational cohort in the city—13.7 percent larger than the second largest generation, the baby boomers.
- Philadelphia’s millennials are less racially diverse than other generations in the city. Just 14.7 percent identify as Latinx while only 37.6 percent of millennials are Black. Conversely, Asians are relatively over-represented among the millennial generation, at 8.6 percent.
- At 42.9 percent, the proportion of millennials with a bachelor’s degree or higher in Philadelphia outpaces the city average by 14.3 percent. However, the proportion of millennials who were unemployed in 2018—at 7.1 percent—exceeded the city average by 2 percent.
- More millennial households of color in Philadelphia occupy lower income brackets than white millennial households. Approximately 12,400 Black millennial households make up 52.4 percent of all millennial households making less than $10,000 a year; 1.8 times the representation of white millennial households at that income level.
Almost one in five Philadelphians living below the federal poverty threshold in 2018 is a millennial.
Who Are Millennials?
Millennials are generally considered to be part of a generational cohort born between 1981 and 1996. A generational cohort is a grouping of individuals by a range of birth years often chosen because of shared cultural and societal experiences. Demographers and economists use these generational cohorts to compare shared social perspectives and economic trajectories [2]. The term ‘millennial’ refers to the fact that these individuals came of age during the turn of the new millennium. Millennials are mostly digital natives, entering school and work during the advent of the Internet and smart phones, with direct experience of the impact these technologies had on living and working patterns. Figure 1 illustrates the main generational cohorts in the contemporary United States.
FIGURE 1
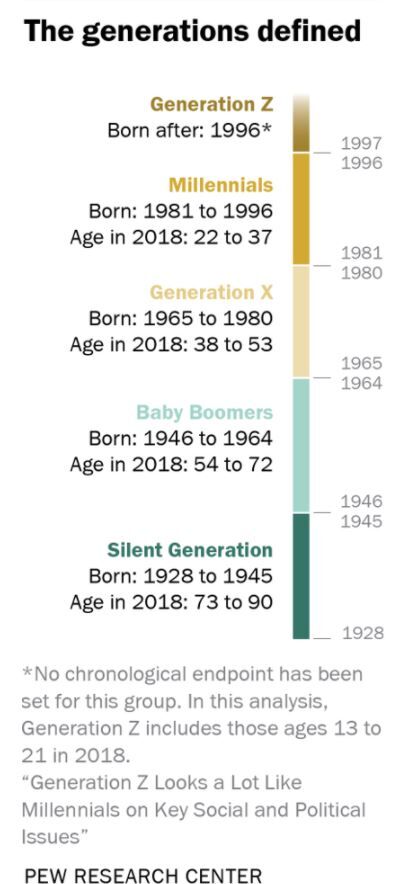
Millennials are the offspring of younger baby boomers and older members of Generation X. They represent the largest generational cohort in the United States to date, totaling around 89 million individuals. The millennial generation makes up approximately 27 percent of the U.S. population and is roughly 4.5 percent larger than the baby boomer generation - the second largest generational cohort in the nation [3]. Figure 2 shows the size of the millennial population as a percentage of the total populations within the City of Philadelphia, the Philadelphia Metropolitan Area, and the United States, respectively. Millennials comprise a higher proportion of Philadelphia’s population than that of the metropolitan area or the country. Philadelphia’s millennials constitute 33.3 percent of the city’s total population and are 13.7 percent larger than the city’s baby boomer population [3]. Although they belong to the same generational cohort, the life experiences among millennials can differ significantly within the age range. For example, many older millennials ranging between 35 and 37 years old may be in the process of getting married or starting their families. The lower-end of the millennial age range—the 22-through-24-year-olds—may just be getting out of college or starting their second or third job. Figure 1 shows how the largest sub-cohort of millennials in Philadelphia in 2018 was between 25 and 29 years old.

FIGURE 2
SOURCE: Data were obtained from five-year estimates of the U.S. Census Bureau’s 2018 American Community Survey. The colored bars represent the millennial generation as of 2018.
Philadelphia’s millennial population is less racially diverse than other generational cohorts. Figures 3 and 4 compare the racial and ethnic makeup of Philadelphia’s generational cohorts as of 2018. The city’s millennial population is predominantly white at 44.5 percent, 3.3 percent greater than the city’s overall white representation. White representation among Philadelphia’s millennials also outpaces the city’s Generation Z and Generation X cohorts by 13.3 and 3.3 percent, respectively, though white representation among the baby boomers outpaces millennials slightly, by 0.7 percent. Higher white representation among Philadelphia’s millennials may result from the well-documented trend of young white professionals preferring to live in urban areas rather than the middle-class suburbs of their youth. Both prior to and after the Great Recession, many young white individuals who originally grew up in middle-class suburbs moved en masse to larger cities and towns to access more employment opportunities and take advantage of urban amenities like public transportation, higher education, cultural and recreational activities, and a greater confluence of retail options [4].
Philadelphia’s Black millennial population is the smallest among the city’s generational cohorts at 37.6 percent and is 4.7 percent smaller than the city’s overall Black representation. It trails Generation Z, Generation X, and the baby boomers by 10.6, 4.7, and 5.2 percent, respectively; each of these generational cohorts all have Black populations slightly larger than the city’s average Black representation of 42.3 percent. The smaller Black representation among the city’s millennial population is most likely the result of the higher concentration of white millennials; but there is also a growing trend among younger Black families of moving to inner-ring suburbs to access more cost-effective housing options and schools that are perceived to be better [5]. Since the 1980s, municipalities surrounding the City of Philadelphia like Lansdowne, Yeadon, and Upper Darby have grown more diverse as a result [6].
Asian millennial representation outpaces the city by 1.4 percent and is greater than Generation Z, Generation X, and the baby boomers by 1.8, 0.9 and 2.4 percent, respectively. Greater Asian representation could reflect the recent growth of the city’s Asian immigrant population or the higher percentage of middle-class Asian millennials moving from the surrounding suburbs into the city [7].
FIGURE 3
NOTE: Data were obtained from five-year estimates of the U.S. Census Bureau’s 2018 American Community Survey. Each racial category includes residents of Latinx/Hispanic ethnicity. The “Total Population City of Philadelphia” accounts for all residents in Philadelphia County, PA in 2018 between the ages of 5 and 74 years old. Generation Z is operationalized as all residents between the ages of 5 and 19; Millennials are all residents between 20 and 34 years old; Generation X is all residents between 35 and 54 years old; Baby Boomers are all residents between 55 and 74 years old.
The city’s Latinx millennial population (14.7 percent) is only slightly higher than the city’s total Latinx population of 14.4 percent. While there are 0.5 percent and 6.3 percent more Latinx millennials than their counterparts in Generation X and the baby boomers, respectively, Latinx representation among Generation Z is 1.4 times that of the millennials.
FIGURE 4
NOTE: Data were obtained from five-year estimates of the U.S. Census Bureau’s 2018 American Community Survey. The “Total Population City of Philadelphia” accounts for all residents in Philadelphia County, PA in 2018 between the ages of 5 and 74 years old. Generation Z is operationalized as all residents between the ages of 5 and 19; Millennials are all residents between 20 and 34 years old; Generation X is all residents between 35 and 54 years old; Baby Boomers are all residents between 55 and 74 years old.
Millennials and the Economy
Millennials form the largest demographic group within the U.S. workforce. Their entry into the labor market has been shaped by major political and economic events— the continued outsourcing of manufacturing jobs, the War on Terror, the Great Recession, and the COVID-19 pandemic—which have caused tremendous volatility in the economy. This instability has made it more difficult for many millennials to follow the “single career” pathways more common for previous generations. Research from both Gallup and LinkedIn reveals that millennials are more inclined to job-hop than members of prior generations [8]. Today’s average recent college graduate will have worked at approximately three different companies in the first five years after graduation [9].
Fewer job opportunities also made for more competitive hiring criteria that favored candidates with more educational credentials. As a result, more millennials pursued collegiate and graduate degrees than Generation X and the baby boomers. As shown in Figure 5, the number of millennials with a Bachelor’s degree or higher in Philadelphia outpaces the city average by 14.3 percent and is 1.4 and 2.1 times greater than that of the city’s Generation X and baby boomer populations, respectively. Philadelphia’s millennials also retain the smallest count of individuals with less than a high school degree. But this proclivity toward more education has also saddled millennials with commensurately greater student loan debt. As of the second quarter of 2019, there were $497.6 billion in outstanding student loan debt for about 15.1 million U.S. borrowers aged 25 to 34, a significant portion of the millennial cohort. This translates into an average student loan debt of around $33,000 per borrower [10].
FIGURE 5
NOTE: Data were obtained from five-year estimates of the U.S. Census Bureau’s 2018 American Community Survey. The “Total Population” accounts for all residents in Philadelphia County, PA in 2018 between the ages of 25 years and older. Millennials are operationalized as all residents between the ages of 25 and 34; Generation X is all residents between 35 and 44 years old; Baby Boomers are all residents between 45 and over.
In terms of employment, at 81.1 percent Philadelphia’s millennials had the highest labor force participation rate among the three working-age generational cohorts (shown in figure 6). In fact, millennials’ labor force participation rate was 1.3 times greater than the city average, 3.1 percent greater than Generation X, and 24.5 percent greater than pre-retirement-aged baby boomers (age 55 to 64). This is unsurprising considering millennials have been dubbed the “overworked” or “burnout” generation for their tendency to job-hop, take on multiple “gigs” to lower debt or supplement income, and their tendency to work more than the typical eight-hour workday out of fear of losing their jobs and benefits [11].
Labor force participation includes all actively employed individuals and the unemployed who are actively seeking employment. Those calculated as not in the labor force are either children too young to work, the unemployed who are not actively seeking employment, retired persons, or individuals not in need of formal employment (e.g. stay-at-home parents, the independently wealthy, informal workers who are paid “off the books,” etc.) [12].
Interestingly, millennials had both the highest rate of labor force participation and the highest rate of unemployment. Roughly 74 percent of millennials were actively employed in the city in 2018 – outpacing Generation X and pre-retirement-aged baby boomers by 1.4 and 21 percent, respectively. Millennial unemployment in 2018 outpaced the city’s unemployment by 2 percent and was 1.8 and 3.5 percent greater than Generation X and baby boomers, respectively. Given the job-hopping norm among millennials, this higher concentration of unemployment—individuals without a job but who are actively seeking employment—is unsurprising.
FIGURE 6
NOTE: Data were obtained from five-year estimates of the U.S. Census Bureau’s 2018 American Community Survey. The “Total Population” accounts for all residents in Philadelphia County, PA in 2018 between the ages of ## and older. Millennials are operationalized as all residents between the ages of 25 and 34; Generation X is all residents between 35 and 44 years old; Baby Boomers are all residents between 45 and over.
Not All Millennials are Made Equal
While it is easy to think of millennials as one large homogenous slice of the city’s population, the millennial experience differs across measures of race and ethnicity. Figures 7 and 8 show the income distribution of the roughly 238,574 millennial households in Philadelphia in 2018. More millennial households of color in Philadelphia occupy lower income brackets than white millennial households. Approximately 12,400 Black millennial households make up 52.4 percent of all millennial households making less than $10,000 a year, 1.8 times the representation of white millennial households at that income bracket. With the city’s median household income averaging around $44,000 in 2018, a Black millennial household is 1.3 times more likely to be making less than $40,000 a year than a white millennial household [3]. Similarly, Latinx millennial households are also among the lowest income brackets with the highest concentration (20 percent) earning between $10,000 and $39,999 in 2018. They join the highest concentrations of multi-racial millennial households and millennial households identifying as “other” along with Native American and Polynesian millennial households who can all be found among the lowest income brackets. Asian millennial households are the only racial group to be more highly concentrated in the higher income brackets – with the highest concentration of 11 percent being found among households making $200,000 or more in 2018.
FIGURE 7
NOTE: Data were obtained from five-year estimates of the U.S. Census Bureau’s 2018 American Community Survey. Each racial category includes residents of Latinx/Hispanic ethnicity. Millennial households are operationalized as any household with a householder between the ages of 25 and 44.
FIGURE 8
NOTE: Data were obtained from five-year estimates of the U.S. Census Bureau’s 2018 American Community Survey. Millennial households are operationalized as any household with a householder between the ages of 25 and 44.
Though the simple measure of income inequality across households fails to account for differences in occupations and employment status, analyzing overall income inequality among households provides a full picture of unequal opportunity among Philadelphia’s millennial workforce. These trends demonstrate that there is an overrepresentation of young people of color in poverty in this city because of white privilege and misappropriated opportunity. Figure 9 further details this inequality by showing the racial breakdown of Philadelphia’s impoverished millennial population in 2018. Millennials comprise just under 20 percent of the total number of Philadelphians living below the federal poverty threshold in 2018. When accounting for race and ethnicity, Latinx millennials account for 30.1 percent of all Latinx residents living in poverty in Philadelphia. Similarly, millennials who identified their racial category as “Other” account for 30.1 percent of all individuals in this racial category living in poverty. Non-Hispanic White millennials only account for 11.5 percent of Philadelphia’s Non-Hispanic White population living in poverty.
FIGURE 9
NOTE: Data were obtained from five-year estimates of the U.S. Census Bureau’s 2018 American Community Survey. Each racial category except for “White (Non-Hispanic) includes residents of Latinx/Hispanic ethnicity. Millennial are operationalized as any resident between the ages of 25 and 34.
Health Implications
Both the demographic and economic composition of Philadelphia’s millennials are key social determinants of health. Health is not just the absence of a disease or chronic condition, it is the aggregate of an individual’s physical, emotional, family, community, economic, and social well-being [13]. Thus, the mounting stress induced by large student loan payments or an inability to access healthcare while job-hopping can contribute to poor mental and physical health.
Millennials also are suffering from a lower economic standing than previous generations. As journalist Anne Helen Petersen notes, millennials are struggling with the fact that they are the first generation who has not surpassed the economic conditions of their parents: "The ‘greatest generation’ had the Depression and the GI Bill; boomers had the golden age of capitalism; Gen-X had deregulation and trickle-down economics. And millennials? We’ve got venture capital, but we’ve also got the 2008 financial crisis, the decline of the middle class and the rise of the 1 percent, and the steady decay of unions and stable, full-time employment.” Millennials’ economic security has also been affected by a pandemic-induced recession. This is not to say that other generations have not been impacted by these more recent economic events as well. But millennials have experienced two major recessions in the foundational years of their labor market experience, which has long term implications.
Health conditions among millennials will be vastly different as well. Although Philadelphia’s millennials are less racially and ethnically diverse than other generational cohorts, millennials of color still suffer from economic inequalities rooted in institutional racism. Previous Leading Indicators briefs have detailed the health disparities of Philadelphia’s communities of color - both before and during the pandemic. The higher average morbidity and mortality rates of Philadelphia’s Black and Brown residents will likely manifest among millennials.
With the launch of the Well City Challenge, we hope to bring greater attention to the multi-dimensional health challenges Philadelphia’s millennials face. With the innovative help of local community-driven ideas, we aim to surface and support local solutions to address prevailing structural health issues.
Works Cited
[1] Blue Cross Blue Shield. 2019. The Health of America: The Health of Millennials, April 24. Retrieved from: (https://www.bcbs.com/the-health-of-america/reports/the-health-of-millennials).
[2] Strauss, William & Neil Howe. 1991. Generations: The History of America’s Future, 1584 to 2069. New York City, NY: William Morrow and Company, Inc.
[3] U.S. Census Bureau. 2019. 2014-2018 American Community Survey 5-Year Estimates. Retrieved from: (https://www.census.gov/data.html).
[4] Florida, Richard. 2015. “Where Millennials are Moving Now.” Bloomberg CityLab, March 26. Retrieved from: (https://www.bloomberg.com/news/articles/2015-03-26/where-millennials-are-moving-now).
[5] Frey, William. 2011. Melting Pot Cities and Suburbs: Racial and Ethnic Change in Metro America in the 2000s. Washington, D.C: Metropolitan Policy Program at Brookings. Retrieved from: (https://www.brookings.edu/wp-content/uploads/2016/06/0504_census_ethnicity_frey.pdfhttps://www.brookings.edu/wp-content/uploads/2016/06/0504_census_ethnicity_frey.pdf).
[6] Blumgart, Jake. 2016. “The Bad Economics of Balkanized Suburbs.” Bloomberg CityLab, February 23. Retrieved from: (https://www.bloomberg.com/news/articles/2016-02-23/pennsylvania-s-delaware-county-a-tale-of-balkanized-suburbs).
[7] The PEW Chartiable Trusts. 2018. Philadelphia’s Immigrants: Who They Are and How They Changed the City. Philadelphia PA: The PEW Charitable Trusts. Retrieved from: (https://www.pewtrusts.org/en/research-and-analysis/reports/2018/06/07/philadelphias-immigrants).
[8] Adkins, Amy. 2016. How Millennials Want to Work and Live. Washington, D.C: Gallup Workplace. Retrieved from: (https://www.gallup.com/workplace/238073/millennials-work-live.aspx).
[9] Berger, Guy. 2016. “Will This Year’s College Grads Job-Hop More Than Previous Grads?” LinkedIn Official Blog, April 12. Retrieved from: (https://blog.linkedin.com/2016/04/12/will-this-year_s-college-grads-job-hop-more-than-previous-grads).
[10] Whistle Wesley. 2019. “Millennials and Student Loans: Rising Debts and Disparities.” New America, October 29. Retrieved from: (https://www.newamerica.org/millennials/reports/emerging-millennial-wealth-gap/millennials-and-student-loans-rising-debts-and-disparities/#:~:text=As%20of%20Q2%20of%20the,%2433%2C000%20dollars%20for%20each%20borrower).
[11] Peterson, Anne Helen. 2019. “How Millennials Became the Burnout Generation.” BuzzFeed News, January 5. Retrieved from: (https://www.buzzfeednews.com/article/annehelenpetersen/millennials-burnout-generation-debt-work).
[12] U.S. Bureau of Labor Statistics. 2015. “How the Government Measures Unemployment.” U.S. Department of Labor – U.S. Bureau of Labor Statistics. Retrieved from: (https://www.bls.gov/cps/cps_htgm.htm).
[13] Swain, Geoffrey R. 2016. “How does economic and social disadvantage affect health?” Focus, 33(1): 1-6. Retrieved from: (https://www.saintlukesfoundation.org/files/resources/foc331a.pdf).