The Unequal Impact of COVID-19 in the U.S. and Philadelphia
Last week, the New York Times published, “The Fullest Look Yet at the Racial Inequality of Coronavirus,” featuring data that shows the disproportionate impacts of the spread of COVID-19 on communities of color. In this Leading Indicator, we review the Times analysis and provide additional context for Philadelphia.
Key Takeaways
- Across the U.S, urban and suburban counties are seeing a higher prevalence of COVID-19 cases among communities of color – with very few exceptions.
- A closer look at local data shows how Black Philadelphians are 2.3 times as likely to contract COVID-19 than white Philadelphians.
- Similarly, Latinx Philadelphians are 1.7 times as likely to contract COVID-19 than white Philadelphians.
- The combination of higher concentrations of workers of color in “frontline” occupations combined with a leagcy of unequal access to healthcare has exacerbated the effects of the COVID-19 virus on Philadelphia’s communities of color.
The “Fullest Look Yet”
This past month, the New York Times obtained CDC data detailing demographic trends of positive COVID-19 cases across U.S. counties. Figure 1 illustrates these trends in the Northeast U.S. with Philadelphia County highlighted. These data depict a clear trend: people of color are disproportionately more susceptible to the virus than their white counterparts - especially in urban areas. The Times explains this trend as a result of both the higher density of communities of color in urban areas and the overrepresentation of workers of color in occupations that involve frequent person-to-person contact.
FIGURE 1
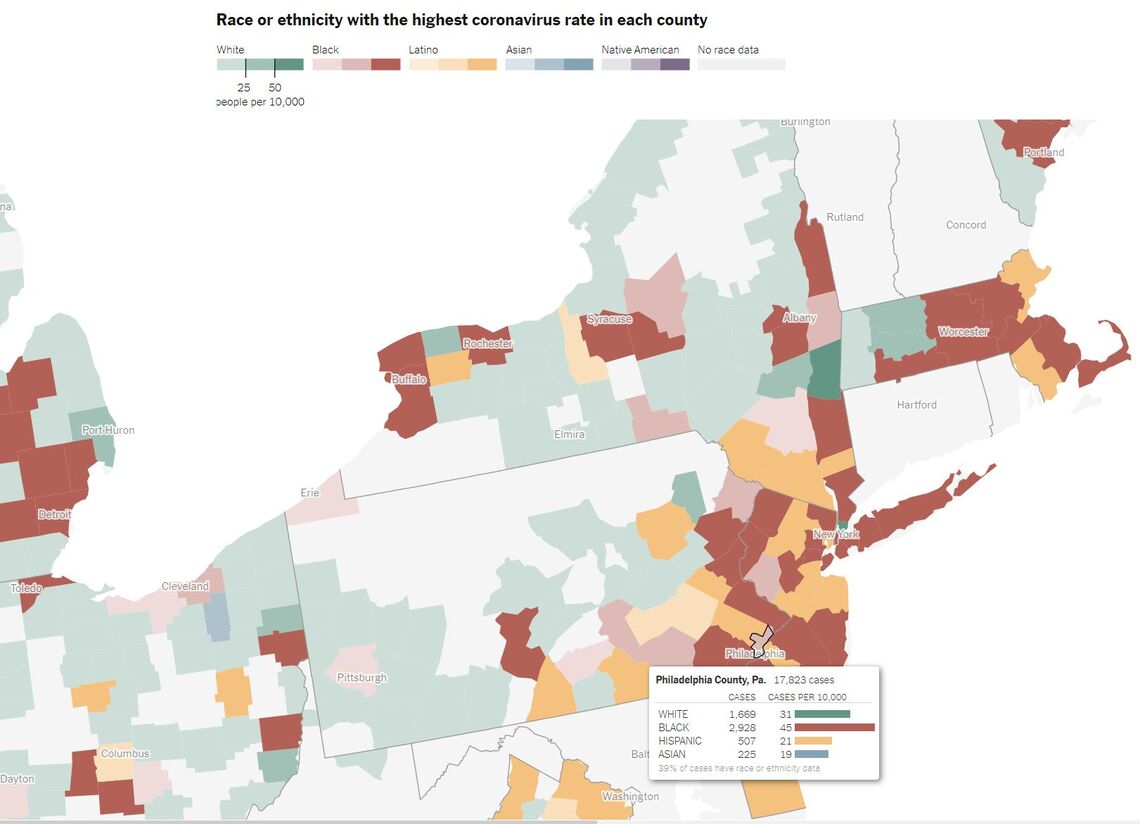
NOTE: The image was copied directly from the New York Time’s article, The Fullest Look Yet at the Racial Inequality of Coronavirus, which is available at https://www.nytimes.com/interactive/2020/07/05/us/coronavirus-latinos-african-americans-cdc-data.html
According to the Times, urban and suburban counties are more likely to see an overrepresentation of non-white positive COVID-19 cases. These counties may host small- to moderately-sized communities of color, but these communities will still be more susceptible to contracting severe cases of COVID-19. This trend resonates across many urban counties. In Wayne County, MI—where Detroit is the most populous municipality—the Black population comprises 39 percent of the total population but has a prevalence rate almost 3 times as high as the white population [1]. In Cook County, IL—the home county of Chicago—the Hispanic population comprises the largest number of cases at 21,161 (43.6% of total positive cases) but only accounts for a quarter of the total population [1]. This relationship plays out across multiple urban and suburban counties with very few exceptions.
For Philadelphia, the Times analysis shows that Black residents both comprise the largest amount of raw cases and have the largest normalized rate of cases per 10,000 residents. In fact, the rate of cases per 10,000 residents is 1.5 times higher for Black Philadelphians than their white neighbors. Even in suburban areas with lower population densities, minorities have higher rates of COVID-19 than white populations. Bucks and Delaware Counties are prime examples where the Non-Hispanic Black populations make up 3.8 and 20.9 percent of each respective county’s population but have prevalence rates 3.1 and 2.3 times greater than their respective white populations [1]. In Montgomery County, the Hispanic population accounts for 79 cases per 10,000 residents while only comprising 5 percent of the total population, whereas the white population accounts for only 16 cases per 10,000 residents while comprising 76.1 percent of the population [1].
It should be noted that the Times’ data are limited both by time and completeness. While the analysis is one of the first to offer national-level comparisons, the Times admits that the data from the CDC only represent collections “through May 2020” and only show states and counties who have shared demographic information of their COVID-19 cases. Many states, such as Maryland, Hawaii, Missouri, Nebraska, New Hampshire, New Mexico, Vermont, and Texas were unable or refused to share the racial and ethnic makeup of their respective positive COVID-19 cases. While some refused for political reasonings, many states cite the inability of health officials to gather comprehensive data from counties with smaller populations and subsequently smaller public health infrastructures. Yet, even with these limitations, the data demonstrate the immense differences between the rates of COVID-19 cases between white and non-white populations and illuminates the stark health disparities communities of color face as a result of systemic racial inequality.
A Closer Look of COVID-19 in Philadelphia
Paralleling the analysis completed by the NYT, we took a closer look at COVID-19 cases within Philadelphia. The City of Philadelphia’s Department of Public Health regularly collects and posts data detailing the impact of COVID-19 within the city. These data detail the prevalence and morbidity of the COVID-19 virus among Philadelphia’s residents across measures of race, ethnicity, gender, and age. Figure 2 shows the prevalence of positive COVID-19 cases among Philadelphia’s population as of July 13, 2020.
FIGURE 2
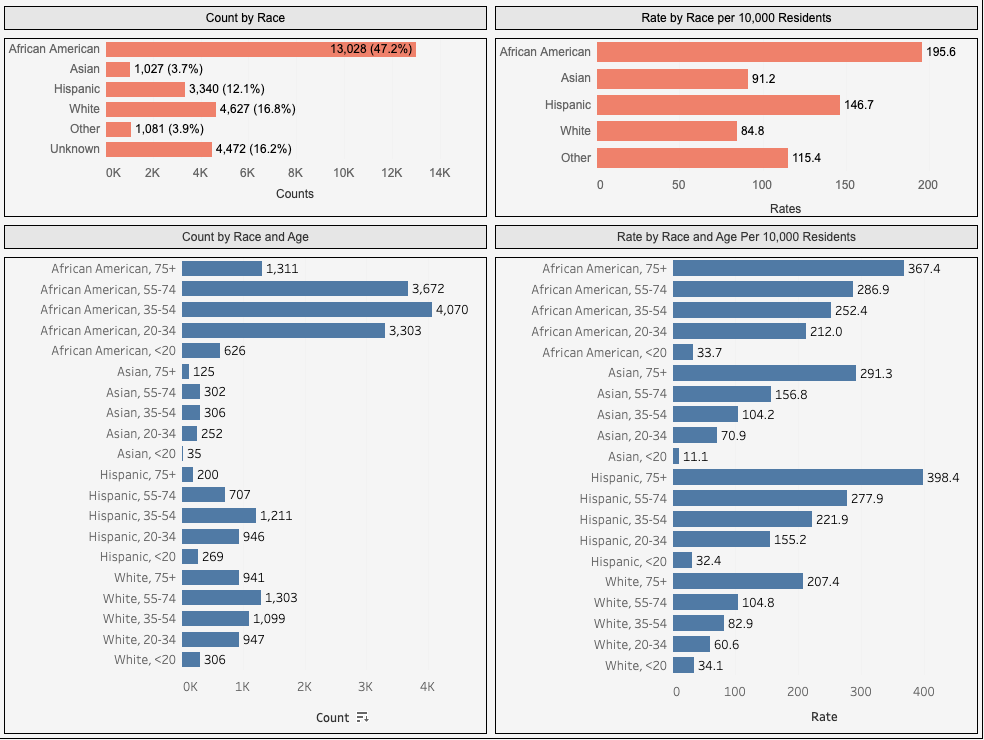
NOTE: This image was obtained from the City of Philadelphia Department of Public Health’s Coronavirus Disease 2019 (COVID-19) webpage: https://www.phila.gov/programs/coronavirus-disease-2019-covid-19/testing-and-data/. The data shown here represent all cases collected from March 20, 2020 to July 13, 2020.
Since the City regularly updates their COVID-19 data, the numbers include two more months of testing than the data acquired by the Times. Overall, the City’s data show a much higher prevalence rate of COVID-19 among non-white Philadelphians than reported in the Times. Positive COVID-19 cases per 10,000 residents among the city’s Black population is 4.4 times greater than estimates from the Times, while the prevalence among the city’s Hispanic population is 7.0 times greater. The gap between white and non-white prevalence is much higher as well. According to the Times, the rate of positive COVID-19 cases per 10,000 residents among Black Philadelphians was 1.5 times greater than white Philadelphians, while the prevalence rate among white residents was 1.5 times greater than Hispanic residents. The City’s data shows this prevalence among Black and Hispanic residents to be 2.3 and 1.7 times greater when respectively compared to white residents.
In previous Leading Indicators and as part of our Color of Inequality special series, we shown that Black and Hispanic residents in Philadelphia are far more susceptible to severe cases of the COVID-19 virus than white populations. Consistent with the Times analysis, Philadelphia’s Black and Brown workers are highly concentrated among “frontline” occupations that are directly dealing with the outbreak of the COVID-19 virus and are less likely to be working from home. Previous Leading Indicators have shown that Philadelphia’s Black workers were highly concentrated in Healthcare Support, Protective Services, Transportation, and Social Services occupations while the city’s Latinx workers had above average concentrations in Construction, Material Movement, and Installation and Repair occupations. The combination of this higher concentration on the frontlines of the COVID-19 pandemic with a legacy of health disparities rooted in concentrated poverty and unequal access to healthcare has exacerbated the effects of the COVID-19 virus on Philadelphia’s communities of color. Figure 3 shows the spatial relationship between race, ethnicity, economic indicators, life expectancy, health insurance coverage, and COVID-19 related vulnerability, prevalence, and death. It shows a more localized impact of the COVID-19 virus on communities of color in Philadelphia.
FIGURE 3
NOTE: Data for these maps were obtained from U.S. Census’ 2014-2018 American Community Survey Five-Year Estimates, the National Center of Health Statistics' U.S. Small-Area Life Expectancy Estimates Project's 2010-2015 estimates, the City of Philadelphia Department of Public Health’s Coronavirus Disease 2019 (COVID-19) webpage and the Social Progress Imperative’s COVID-19 Vulnerability Index.
Figure 3 corroborates a few hypotheses put forth by the Times analysis. First, the number of COVID-19 cases and deaths differ depending on the racial and ethnic makeup of the neighborhood. Neighborhoods with predominantly Black and Brown residents tend to have higher rates of COVID-19 cases. These neighborhoods are also more likely to have lower than average household incomes, lack access to health insurance, and a higher vulnerability to the COVID-19 virus - based on the Social Progress Imperative’s COVID-19 Vulnerability Index, which uses population demographics, underlying health issues, and health infrastructure to measure COVID-19 vulnerability.
Conclusion
Both the New York Times and City of Philadelphia’s data demonstrate that public health crises like the COVID-19 pandemic tend to expose the cracks within our healthcare, occupational, and housing systems. These cracks often form along lines of race, ethnicity, and income. With a long history of structural racism, every new disease or health crisis disproportionately puts communities of color at greater risk of illness and death. Pandemics are not colorblind, so our responses to this crisis should not be either.
Works Cited
[1] U.S. Census Bureau. 2019. 2014-2018 American Community Survey 5-Year Estimates. Retrieved from: (https://www.census.gov/data.html).