The Color of Inequality Part 1: Housing and the Built Environment
By: Mike Shields & Mohona Siddique
Date: June 4, 2020
AUTHORS' NOTE:
As the country was buckling under the weight of the COVID-19 pandemic, the widely broadcast killing of an unarmed Black man, George Floyd, by a white Minneapolis police officer along with Amy Cooper's threatening use of police force to confront Christian Cooper in Central Park added to a litany of events that precipitated renewed protests against police brutality across the nation. While some protests remained peaceful, like those in Camden, New Jersey, peaceful protests in Philadelphia incited civil unrest and resulted in violent confrontations. It is not the first time that communities in Philadelphia have protested against racial injustice and police brutality, and the events of recent weeks are not isolated. Rather, they exist within the historical context of the intersection of race and economic opportunity – and for Black Americans and many other communities of color in the U.S, economic opportunity and mobility still remain out of reach.
To provide context and data to inform ongoing conversations about structural racism and illustrate how these enduring inequalities have shaped present-day neighborhood and civic relations in Philadelphia, the Economy League of Greater Philadelphia is launching a special Leading Indicator series called The Color of Inequality. The series will highlight measures of racial and ethnic inequality in the City of Philadelphia to contribute to ongoing conversations about racism and prejudice.
The Color of Inequality Part 1: Housing and the Built Environment
For those of us who live in Greater Philadelphia, the narrative of Philadelphia as “the poorest big city in America,” is not unfamiliar. What may be less familiar is how Philadelphia’s persistently high poverty rate derives directly from a legacy of racialized policy and planning decisions. For centuries, policy has been wielded as a weapon to marginalize African Americans in the U.S, which the Brookings Institution’s Andre Perry refers to as “policy violence.” While this notion encompasses a broad range of historic and modern policies, this installment of the Color of Inequality will focus on policies that impacted the built environment and housing to unpack how the very real consequences of these policies manifest as poverty in present-day Philadelphia.

Redlining
Redlining laid the foundation of many race-based inequalities that exist in our built environment. To curb the effects of the Great Depression, the federal government created the Federal Housing Administration (FHA) and the Home Owners Loan Corporation (HOLC) in 1933. The HOLC’s role was to assess the financial risks of refinancing mortgages for homes in default [1]. The agency’s key risk assessment tool was a series of maps, which drew literal red lines around Black and “ethnic” neighborhoods, designating them as “less valuable” and “higher risk” for mortgage refinancing [2]. Federal policy established the paradigm, and—for much of the twentieth century—public and private mortgage lenders color-coded U.S. neighborhoods by race, inextricably tying real estate value and lending risk to racial and ethnic demographics. Many communities of color became “locked in place” since there were very few resources available for building equity or selling their property. This policy decision not only spatially segregated many cities and towns, but also robbed low-income minority populations from building assets in the form of home ownership. Thus, redlining set the stage for a persistent racial wealth gap that continues to this day.

Suburbia and White Flight
Suburbia and white flight are also the result of federal policy decisions that were biased against communities of color. After WWII, the Federal Housing Administration (FHA) and the Veterans Administration (VA) subsidized mortgages for millions of U.S. families [3]. The government also backed construction firms that were subdividing rural farmland and wooded areas into parcels for new homes and housing subdivisions built exclusively for white families. The VA modeled its loan program after the FHA’s, offering homeownership services and advantages only to white veterans which provided a powerful incentive to flee cities [4]. At the same time, the Defense Highway Act of 1956 created the modern interstate highway system which further facilitated suburban construction and white relocation. This created a vicious cycle: whites followed the subsides to the suburbs, while African Americans were barred from receiving the same subsidies and consigned to urban areas with stagnant or declining property values. White suburbs were able to tap rising property values to fund key amenities like public schools, while increasingly Black inner cities saw their tax bases erode; the resulting decline in services led to further white flight.

Urban Renewal
Urban renewal further disadvantaged communities of color by reprioritizing urban areas for the benefit of wealthier white communities. As white flight intensified, cities began to face serious financial troubles as tax bases began to shrink. Across the U.S, planning commissions and redevelopment authorities in major cities invented new ways to attract and retain wealthier white residents. After being lobbied by city leaders, Congress signed the Housing Acts of 1949 and 1954 to subsidize “urban renewal” initiatives in the 1950s and 1960s, which involved the demolition of low-income neighborhoods to make way for private development, public parks, and highways [3]. Prominent examples include Robert Moses’ creation of the Cross Bronx Expressway in New York City, the razing of Boston’s West End neighborhood, and Ed Bacon's development of Philadelphia's Society Hill on what once was the Fifth Ward’s largely Black community. By the 1970s, urban renewal through demolition was recognized as inherently discriminatory to low-income communities and has largely been reformatted for modern times.

Gentrification
Gentrification is the result of unfavorable political and market conditions for many communities of color. Defined as the rapid influx of higher-income individuals into lower-income neighborhoods, gentrification has become a flashpoint in many cities. After decades of flight to the suburbs, higher-income whites began gradually moving back into urban neighborhoods by the late 1970s [5]. By the early 2000s, the return of middle- and higher-income whites to cities picked up steam. Whites moved back to urban centers to be closer to jobs, schooling, and urban amenities; as a result, property values and rents in gentrifying neighborhoods substantially rose. In some cities, this led to displacement of lower-income residents. Federal, state, and local policies such as tax incentives, urban revitalization programs, re-zoning, and high-return private development incentives facilitated gentrification [6]. For many low- and moderate-income residents of color who spent decades building community and keeping neighborhoods intact, gentrification represents an ironic turn of events: redlining and other discriminatory policies kept property values low, facilitating the return of whites to inner cities who could then displace the original communities of color. In theory, rising property values brought about by gentrification ought to create wealth for long-time Black and Brown homeowners, but, in practice, predatory investors have too often swooped into gentrifying neighborhoods and offered “quick cash” to low- and moderate-income homeowners long before values hit their peak. Brookings’ Andre Perry and others have estimated the cost of uncaptured wealth and value destroyed by the decline in real property values due to redlining to be in the hundreds of billions of dollars.

Additional Policy Violence
The topics previously discussed are by no means exhaustive. There are many other ways that land use and zoning policies as well as informal practices have been wielded to spatially encode discrimination against people of color:
- contemporary exclusionary zoning practices that both concentrate wealth in wealthy and primarily white communities, and also segregate communities by race;
- realtor blockbusting while illegal since the Fair Housing Act of 1968, has instilled a legacy of white sensitivity to racial composition of neighborhoods that reflects itself in real estate value
- neighborhood covenants that restrict neighborhoods by race. While the Supreme Court struck down this practice in 1986, the legacy of this real estate practice remains today
- housing voucher discrimination is in practice, illegal. However, it remains a common practice among landlords, and the process of searching for housing with a voucher is both time-consuming and frustrating for those who rely on Housing Choice Vouchers.
The Leading Indicator: Segregation in Today's Philadelphia
To illustrate the collective impact of these policies, Figure 1 depicts a dot density map using race and ethnicity measures from five-year estimates of the 2018 American Community Survey. The map shows the concentration of Philadelphia’s racial and ethnic groups in specific neighborhoods and sections of the city. It also shows how the legacy of redlining has kept many minority neighborhoods poor.
FIGURE 1
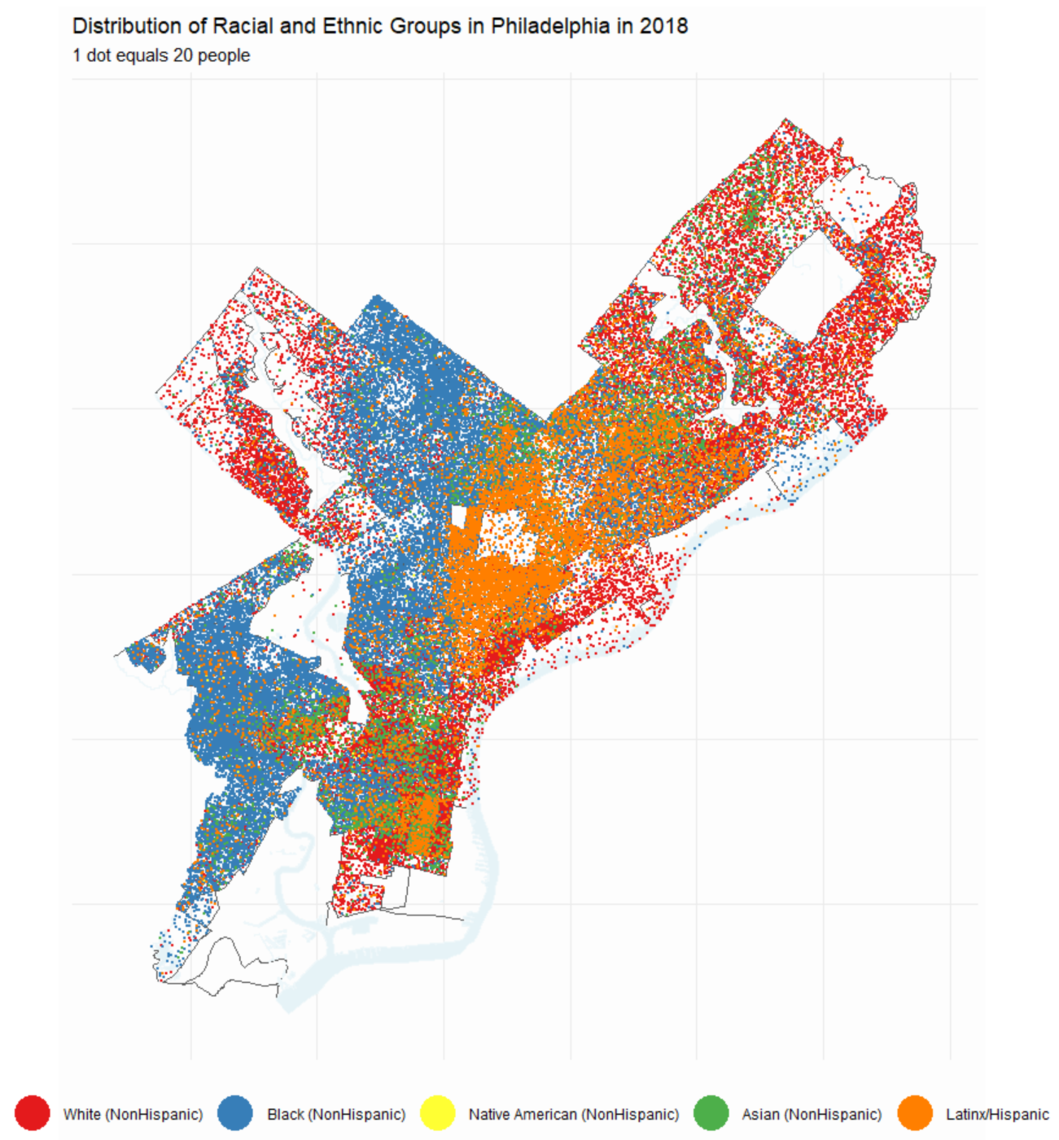
Figure 2 details the economic impacts of racial concentration and segregation. Median household incomes in majority-Black census tracts are 48 percent of the median household income in white-majority tracts (a difference of $35,838). The poverty rate is 2.6 times higher in majority-Black tracts versus majority-white. While non-Hispanic whites represent a smaller proportion of the population than African Americans, non-Hispanic white-majority tracts comprise 40 percent more land mass than Black-majority tracts, largely due to the fact that many non-Hispanic whites live in peripheral neighborhoods of the city with density that resembles the surrounding suburbs. Median household incomes in Hispanic/Latinx-majority tracts are even lower, roughly 35 percent of the median household income in white-majority tracts, with a poverty rate that is nearly 4 times that of white-majority tracts. Interestingly, tracts that have no dominant racial or ethnic group have median household incomes and poverty rates that roughly resembles the city as a whole.
FIGURE 2
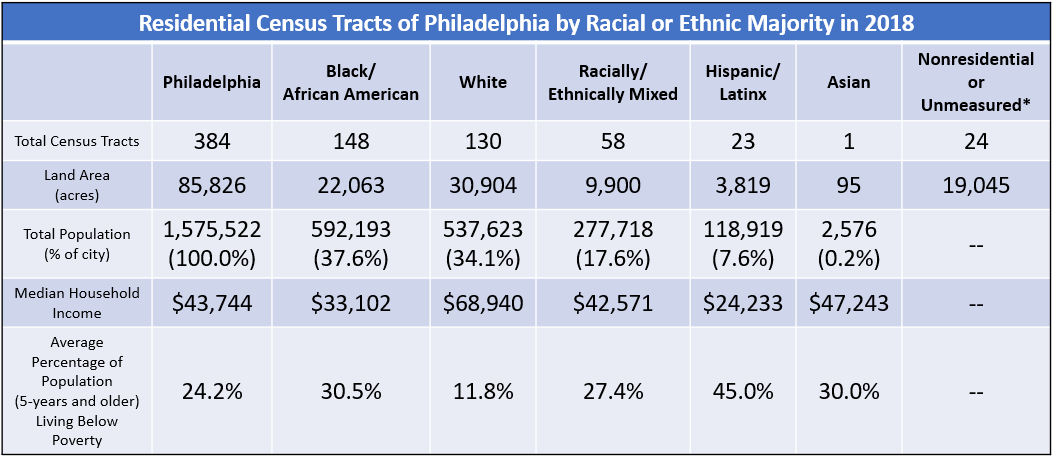
* Unmeasured tracts include any census tract with a population less than 500 residents and any tract where "group quartering" residents exceeded one-third of the total population.
This spatial analysis suggests that discriminatory policies and trends have long-term negative economic impacts on communities of color – further contributing to these communities’ collective frustration and distrust that often manifest in protest. And yet this analysis only focuses on policies related to housing and the built environment; a small piece of a vast tapestry of structural inequalities that have kept communities of color at a disadvantage. Since structural inequality is the result of policy decisions and practices, informed decisions and practices can lead to better outcomes.
Works Cited
[1] Mitchell, Bruce & Juan Franco. 2018. “HOLC “Redlining” Maps: The Persistent Structure of Segregation and Economic Inequality.” National Community Reinvestment Coalition (NCRC), March 20. Retrieved from: (https://ncrc.org/holc/).
[2] Madrigal, Alexis C. 2014. “The Racist Housing Policy That Made Your Neighborhood.” The Atlantic, May 22. Retrieved from: (https://www.theatlantic.com/business/archive/2014/05/the-racist-housing…).
[3] Jackson, Kenneth. 1985. Crabgrass Frontier: The Suburbanization of the United States. New York City, NY: Oxford University Press.
[4] Gross, Terry. 2017. “A 'Forgotten History' Of How The U.S. Government Segregated America.” National Public Radio (NPR), May 3. Retrieved from: (https://www.npr.org/transcripts/526655831).
[5] Gottlieb, Dylan. 2019. “How gentrification caused America’s cities to burn.” The Washington Post, September 13. Retrieved from: (https://www.washingtonpost.com/outlook/2019/09/13/how-gentrification-ca…).
[6] Kennedy, Maureen & Paul Leonard. 2001. Dealing with Neighborhood Change: A Primer on Gentrification and Policy Choices. The Brookings Institution Center on Urban and Metropolitan Policy and PolicyLink, April Discussion Paper. Retrieved from: (https://www.brookings.edu/wp-content/uploads/2016/06/gentrification.pdf).