Part 1: Automation and Greater Philadelphia's Food Economy
By: Mike Shields, Mohona Siddique, and Andrew Strohmetz
Date: October 7, 2020
Automation in Greater Philadelphia's Food Economy
For the first installment of the Automation Nation series, we take a closer look at the automation potential within Greater Philadelphia’s food economy. The Economy League has deep expertise about the regional food economy including, its growth and the impact of the pandemic on its future. As discussed in the 2019 Good Eats report, Greater Philadelphia’s food-based businesses fuel extensive commercial activity and create thousands of jobs in the region. Yet many of these jobs offer minimal pay and few sustainable career trajectories. Since many occupations within the food economy are also characterized by a high number of routinized daily tasks that are susceptible to automation, the sector may act as a benchmark for comparison among other regional industries.

Greater Philadelphia’s food economy consists of six major sectors: food production, food processing, food distribution, food retail, food hospitality, and food waste. This web of activity supports 363,000 jobs across Greater Philadelphia as of 2019. Philadelphia itself is home to 75,000 food-related jobs across 65,000 firms. This accounts for over 20 percent of all food-related jobs and firms in the region.

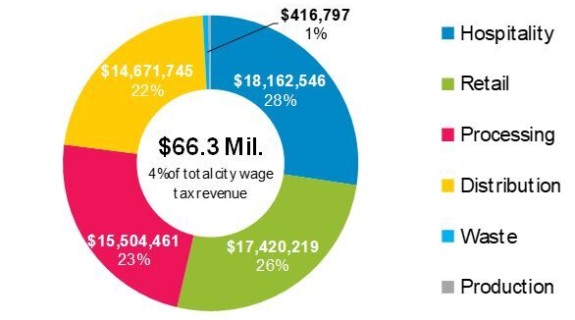
Overall, the food economy generates $66.3 million in annual wage tax revenue for the City of Philadelphia, accounting for 4 percent of total wage tax receipts. Roughly half of this revenue comes from the food hospitality and food retail sectors. Food distribution and food processing, despite relatively small employment bases, also generate a significant amount of wage tax revenues—the result of higher average wages in these sectors. The food waste and recovery sector, on the other hand, represents only 1 percent of the wage tax revenue generated by food-related businesses. Between 2012 and 2016, wage tax revenue from food-related businesses increased by an annual average of 3.7 percent, closely following overall revenue.

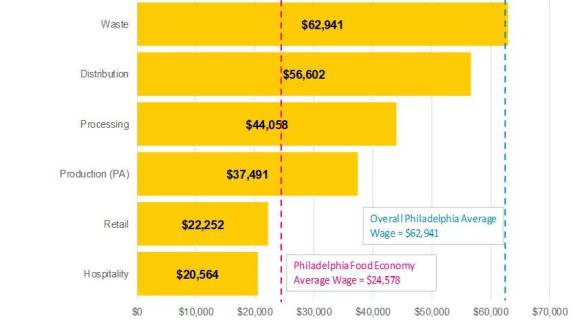
Food hospitality and food retail, the two largest employers in the Greater Philadelphia food economy, also have the lowest wages. Low wages may be part of the reason that employees do not stay at a single job long, causing high levels of churn, but opportunities still exist for living wage work. Employers across the food economy, especially those in retail and hospitality, report being in a constant hiring cycle. Unpredictable schedules and low wages cause workers to leave with little or no notice, particularly in food retail and food hospitality. Meanwhile food-related businesses report difficulty finding qualified workers with basic “soft skills,” citing ‘showing up to work,’ ‘showing up on time,’ ‘work ethic,’ ‘customer service,’ and ‘consistency,’ as top HR challenges. While churn is an operational challenge, it means that there are constantly entry-level opportunities for those seeking entry-level work for the first time or for returning citizens, for example, to enter the workforce. The City of Philadelphia has recently tried to improve working conditions for entry-level food retail and food hospitality workers by mandating earned sick leave and fair work weeks, which provides for more predictable work shift scheduling.

E-commerce and the platform economy have redefined the food economy in just a few years. From grocery delivery via Instacart to making reservations with OpenTable, e-commerce makes the buying and selling of food-related products and services more convenient for consumers through food courier and delivery services. Companies like GrubHub, Caviar, and UberEats are changing the way people purchase food and the way food-related businesses interact with their customers. These changes are spurring typical food businesses to adapt. For example, a small full-service grocer in West Philadelphia called Sunshine Market began offering delivery services, and now delivers between 20 and 30 grocery orders per day in the first two weeks of every month. But the entrance of retail giants like Amazon into food e-commerce pits smaller businesses against companies that can take advantage of economies of scale and puts downward pressure on prices and therefore on profit margins. The increased use of delivery services can lead consumers away from brick-and-mortar food hospitality establishments, which may then have fewer retail or front-of-house jobs as a result. The delivery jobs that displace those lost to e-commerce are not necessarily equal: most platform workers are independent contractors whose wages are typically lower than their W-2 employee counterparts; they are are exempt from minimum wage laws and usually do not receive even basic protections like workers’ compensation. So, while e-commerce can be a boon to consumers, it is creating vulnerability for both entry-level employees and small business growth.
The Leading Indicator
With Greater Philadelphia’s food economy encompassing roughly 15 percent of the region's total employment as of 2019 [1], we took a closer look at the automation potential of food economy occupations by sector. Using an “automation potential” probability score—developed by Brookings and the McKinsey Global Institute—we calculated the average automation potential within each food economy sector and compared it with the metropolitan region as a whole (see Figure 1).
FIGURE 1

Figure 1 demonstrates that the region’s food economy has an overall higher-than-average susceptibility to automation. When de-aggregated by sector, automation potential is exceedingly high in the regional food economy’s Processing and Hospitality sectors, higher-than-average for the Distribution sector, and below average for the Production, Retail, and Waste sectors.
To further elucidate these automation potential scores, Figure 2 illustrates the spectrum of food economy occupations within each sector by their individual automation potential score.

FIGURE 2
NOTE: Data were obtained from Brookings’ 2019 Automation and Artificial Intelligence: How Machines are Affecting People and Places Report. "Low" automation potential is any occupation with a probability less than 33.34%, "Medium" automation potential is any occupation with a probability between 33.34% and 66.7%, and "High" automation potential is any occupation with a probabilty greater than 66.7%.
Occupations colored blue have a low automation potential, meaning that daily tasks are less likely to be replaced, diminished, or redistributed due to the introduction of new technologies. Most of these occupations are specialized because they require advanced educational credentials, or they are higher-tiered management or supervisory positions. Some outliers include the Refuse and Recyclable Materials Collectors in the Waste sector and the Laborers and Freight, Stock, and Material Movers in the Distribution sector. The commonality among these occupations is that their daily tasks are not routinized enough to be predicted and replicated by machines. Machine learning and artificial intelligence have not reached the point where they can conduct scientific experiments on crop rotation methods, nor are their computer programs that can navigate the intricacies of workplace disputes and conflicts. Even the refuse and recyclable materials collectors must consistently adapt to changes in their daily routine like new weather conditions, new routes, changes in the weight or size of their daily pickups, or changes to their drop-off sites. The variability of their daily tasks makes it difficult for automation.
Occupations with medium automation potential are colored purple and include a variety of jobs. Unlike the low automation potential occupations, medium automation potential occupations have lower educational requirements and less variability in their daily tasks. In fact, some of these occupations have already been altered by the introduction of technology in their daily work. It was not too long ago that cashiers were required to punch-in item prices, be aware of all sales and markdowns, and keep track of inventory. The introduction of automated scanners and new computer programming diminished the tasks of the human cashier to primarily assisting with checkout and bagging. Many of these occupations may further be altered by new technologies.
Finally, the high automation potential occupations are colored red. Many of these occupations can be found in the Processing, Distribution, and Hospitality sectors. These occupations only require foundational-level skillsetsand minimal educational training. Their daily tasks also have a higher chance of being routinized within minimal variability. These occupations face the greatest risk of seeing new technologies replace, diminish, or redistribute their daily tasks. Greater Philadelphia's food economyis one of the largest employers within the region. Its high automation potential signals that many of the foundational skilled and entry-level occupations are highly susceptible to being upended by new technologies. Thousands of employees within our region are at risk or being replaced or downgraded because of the adoption of a new technology. In this time of economic upheaval, there is an opportunity for the emergence of new workforce development strategies that will alleviate the burden of automation.