Know Your Price, Philadelphia, Part IV: Housing Price & Demographic Change in Racially Mixed Neighborhoods
In this follow-up piece to our Know Your Price, Philadelphia report, we take a look at sample neighborhoods that are racially mixed in the present day. To build a sample, we began by filtering Philadelphia neighborhoods that were between 40-60% white in 2020. That brought up a pool of a few main areas: Northeast, Northwest, West, and South Philly. From that group, we looked for neighborhoods that had been racially mixed over the course of the decades of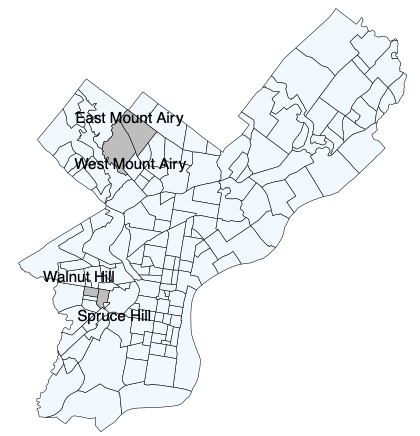 our study. Like the city as a whole, most neighborhoods that are racially mixed today were majority white from 1950-2000, with only a relatively recent influx of non-white residents.
However, since we are interested in capturing home valuation of racially mixed neighborhoods over time, we were able to identify four neighborhoods that have maintained a racially mixed demographic (between 40-60% white) since at least 1990 - West Mount Airy and East Mount Airy, contiguous neighborhoods in the northwest section of the city, and Spruce Hill and Walnut Hill, contiguous neighborhoods in West Philadelphia. We explore here how median home prices vary in racially mixed areas, comparing these two neighborhoods to adjacent ones.
Northwest: West Mount Airy
In West Mount Airy, the population has been between 40-60% white since 1970. The white population fell to its lowest proportion of the neighborhood in 2000, 43%, but sits at 53% in 2020. Likewise, the Black population has been consistently the second largest group, slightly surpassing the white population in 2000 but decreasing in the decades since. The growth of the Black population took place primarily between 1950-1970, and has undergone little change since.
Figure 1:
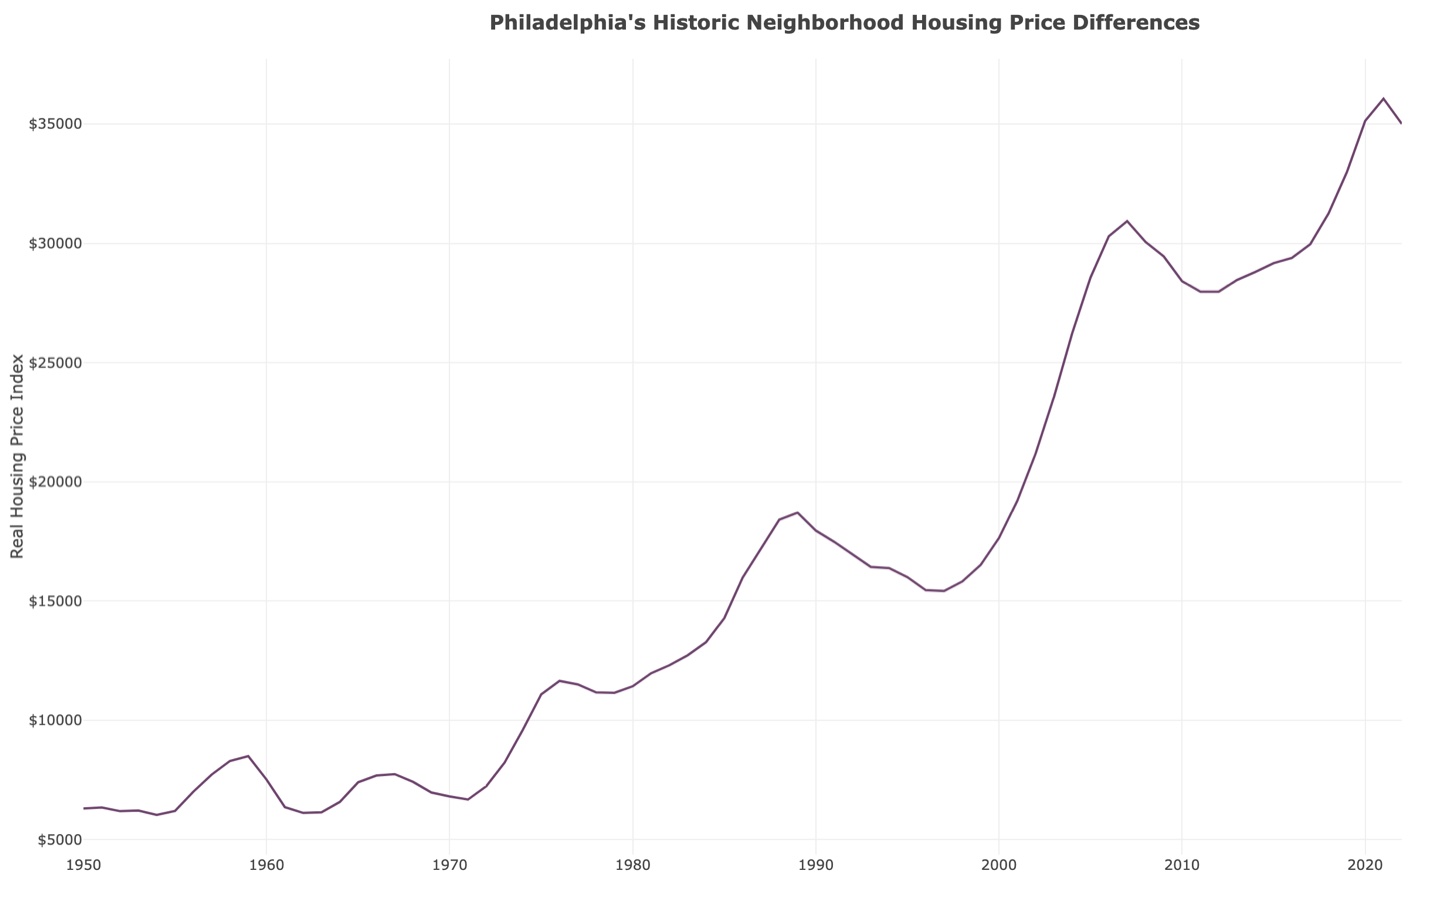
Real estate values in West Mount Airy have been trending upward since the 1950s, moving through minimal peaks and valleys. Since the neighborhood’s population demographics have been relatively consistent since 1970, it follows that there haven’t been any abrupt changes in housing prices.
Figure 2:
Northwest: East Mount Airy
East Mount Airy can also be considered racially mixed, but with more significant changes over the last several decades. While it was 43% white in 1970, it is only 22% white in 2020. The Black population reached its peak in 1980, was constant through 2000, and has since declined. The overall population in East Mount Airy has been consistently decreasing since 1960.
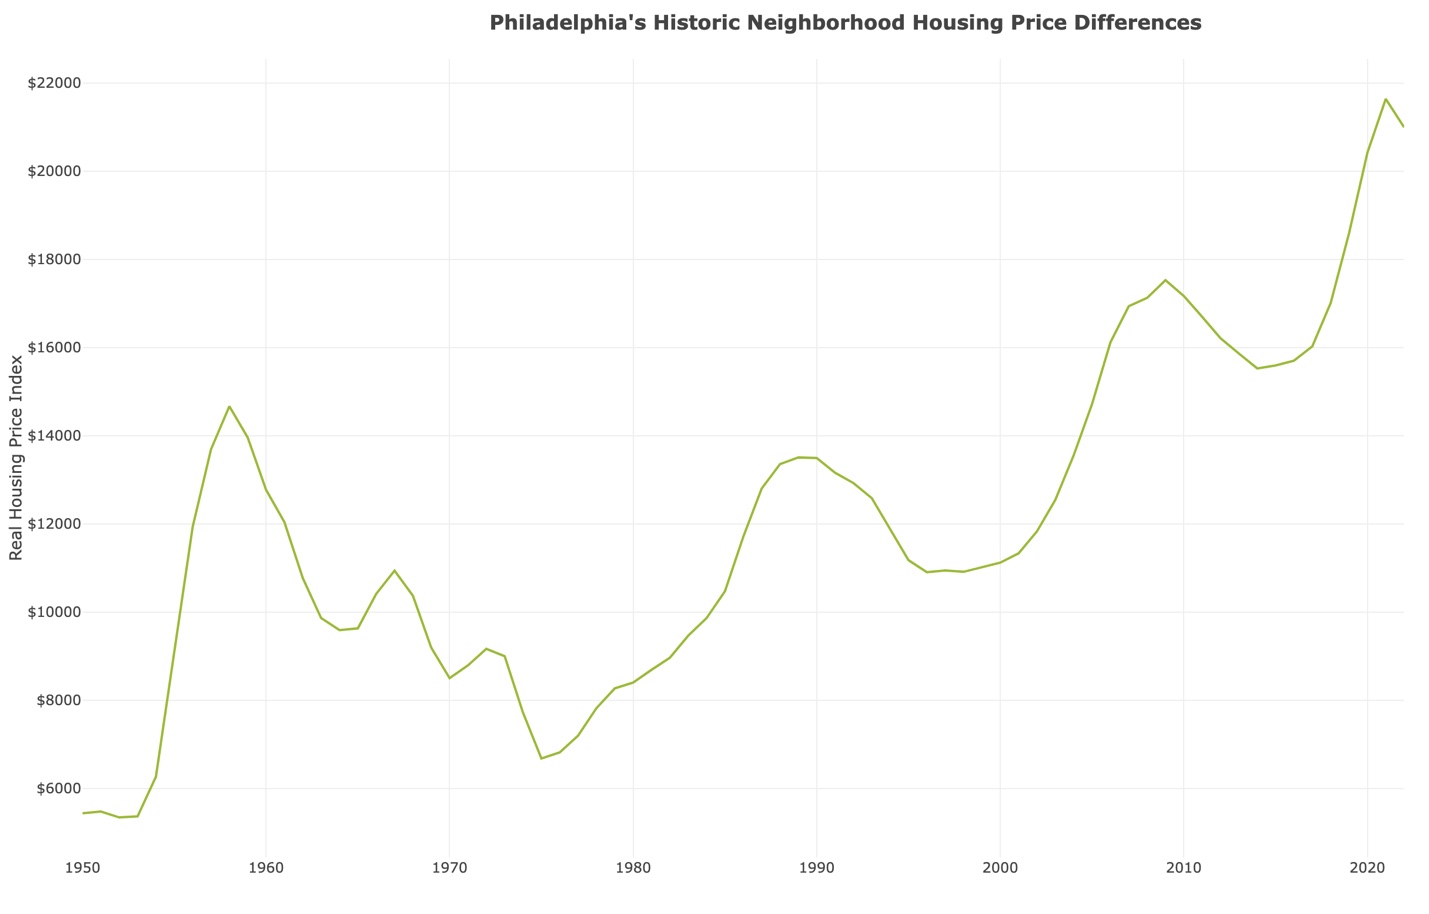
Figure 3:
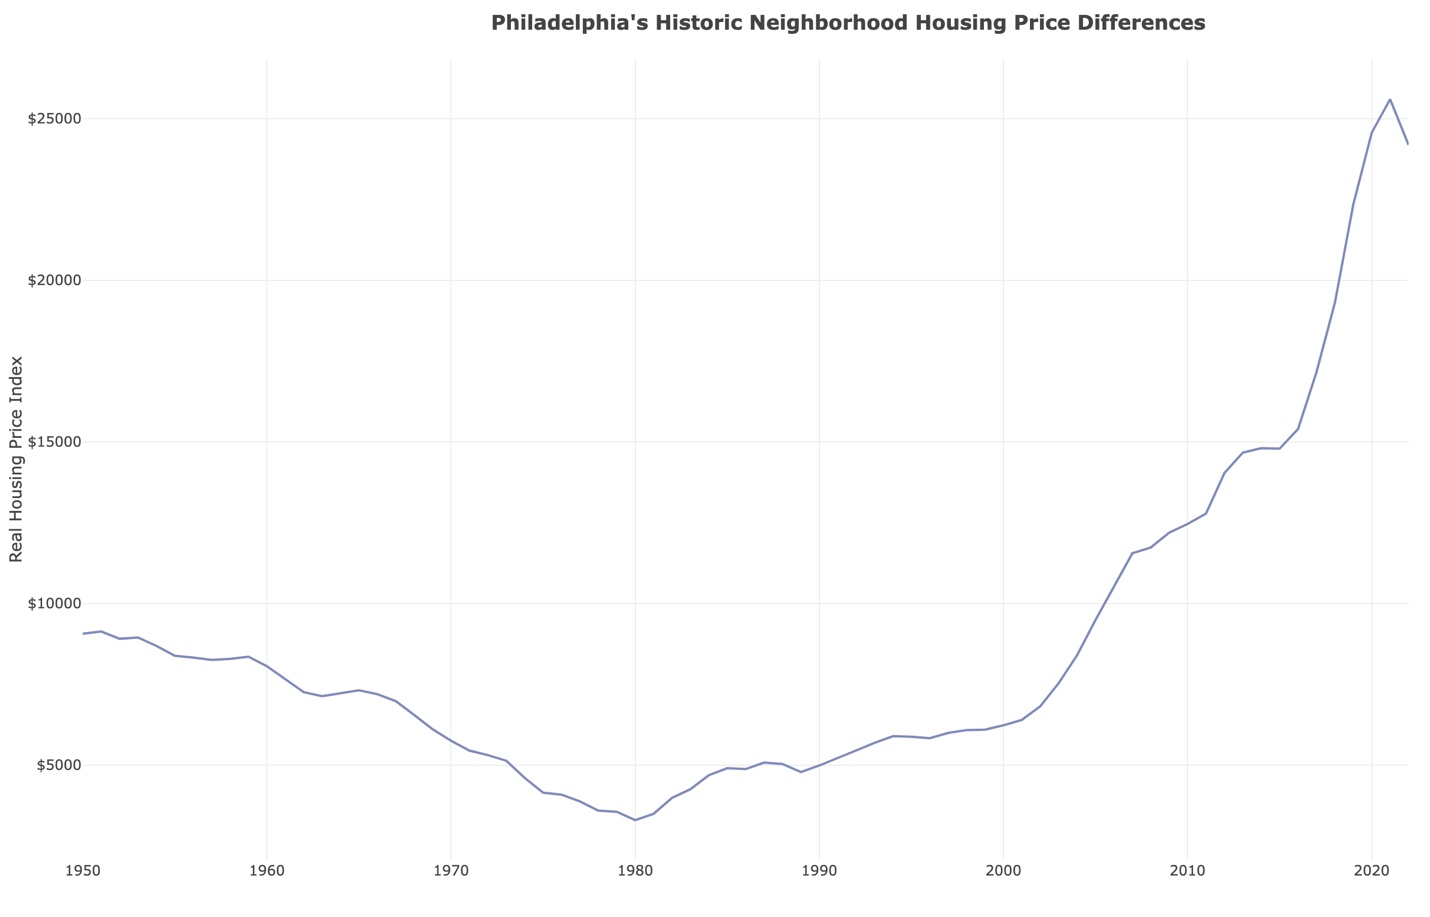
While home values in East Mount Airy and West Mount Airy follow a similar upward trend, prices in West Mount Airy have appreciated considerably more. As of 2022, the housing price index in West Mount Airy is 67% higher than the index in East Mount Airy. East Mount Airy also saw a notable drop in prices from 1958 to 1975. This correlates with the time period when the white population fell from the majority to the minority group.
Figure 4:
Spruce Hill
Spruce Hill exhibits gradual population loss over the last seventy years. From 1980-1990, the white population fell from 65% to 55% of the neighborhood, then to 44% in 2000. Since then, white residents have made up just over 50% of the population. The decline in white residents has been accompanied by growth in Black and Asian groups. The Black population reached its peak in 2000, while the Asian population peaked in 2010.
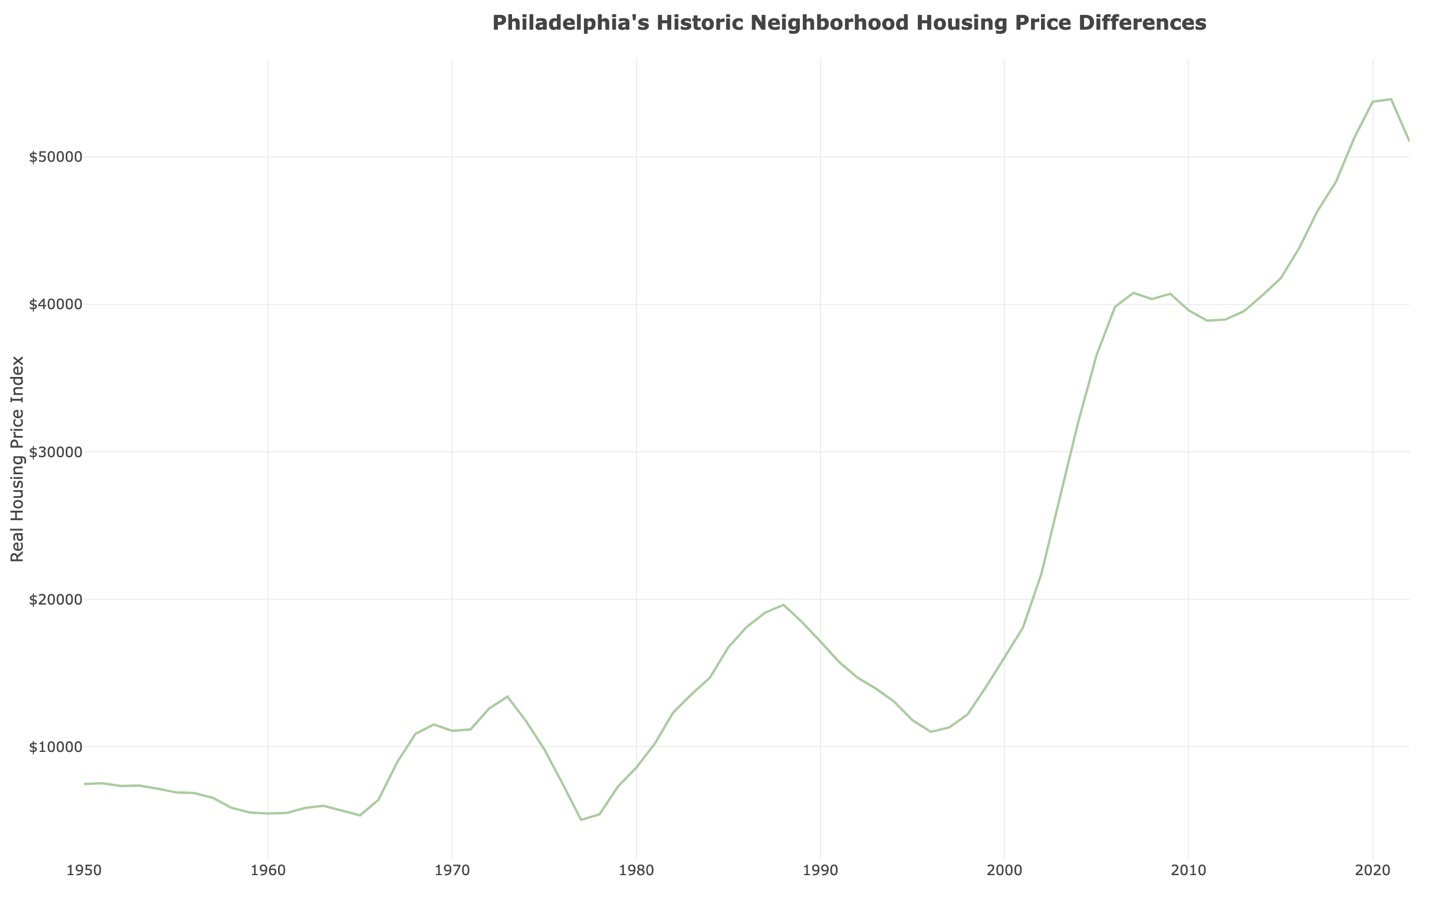
Figure 5:
Housing prices in Spruce Hill follow a similar trend to West Mount Airy, with peaks and valleys largely corresponding to external shocks like recessions. However, prices in Spruce Hill grew more steeply and experienced greater fluctuation. Spruce Hill’s price index began just 18% above West Mount Airy in 1950 and grew to 50% greater than West Mount Airy in 2021. The two most significant losses in housing values happened in the mid-1970s and early 1990s. However, based on our analysis capturing only the beginning of each decade, we can’t identify any abrupt demographic changes happening during those periods.
Figure 6:
Walnut Hill
While Walnut Hill has experienced population loss similar to Spruce Hill, its overall demographics are markedly different. Walnut Hill can also be considered mixed race as it has maintained a significant population of both Black and white residents since 1960. However, Black residents were the majority group from 1970 through 2010. As of 2020, the Black population dropped to 38% of the neighborhood, while the white, Latino, and multiracial groups have grown.
Figure 7:
Housing values in Walnut Hill also look significantly different from the other neighborhoods shown here. Firstly, there is little fluctuation, but rather steady movement downward and then steady movement updward. Prices decline from 1950-1980, then rise each year until 2021. Compared to neighboring Spruce Hill, Walnut Hill experienced very little value increase over the last seventy years. As of 2022, the housing price index in Spruce Hill is more than 200% greater than Walnut Hill. As seen in our Northwest neighborhood pair, the disparity between growth in Walnut Hill and Spruce Hill may be correlated with the proportion of residents who were Black. It is important to note that values in both Spruce Hill and Walnut Hill take off around 2000, a few years after the formation of University City District and concerted efforts by the University of Pennsylvania to redevelop its surrounding neighborhoods.
Figure 8:
Takeaways
This analysis suggests that racial composition of a neighborhood is highly correlated with housing values, but also that the impact on housing values by large anchor institutions like Penn and Drexel can be profound. Values in the Northwest are a little more complex; while properties in West Mt Airy experience a steady decline, those in East Mt Airy decline sharply once the neighborhood becomes majority Black in the 1970s, but interestingly they recover quite robustly from about 1990 onward. This probably calls for further consideration of exogenous variables.