How Similar are Philadelphia and New Orleans?
In this Leading Indicator, we use our Similarity Index to highlight and compare the quantitative similarities between Philadelphia and New Orleans, the destination for the Economy League’s 2023 Greater Philadelphia Leadership Exchange (GPLEX) conference. Our Similarity Index compares and benchmarks U.S. counties across twelve unique dimensions to create a comprehensive picture of similarities and differences between various geographic areas. We show that Philadelphia and New Orleans share much in common, one of many reasons we chose New Orleans for GPLEX 2023.
What You Need to Know
- Our multi-dimensional Similarity Index shows that despite major differences in both population and geographical scale, New Orleans and Philadelphia are very similar across numerous socioeconomic indicators.
- Philadelphia and New Orleans display similarity across measures of poverty and labor force participation as well as GDP per capita, median income, and life expectancy.
- Both Philadelphia and New Orleans have high poverty rates and high labor force participation compared to other counties in our analysis. On the other hand, they also share low GDP per capita, median household income, and life expectancy.
- The two cities differ on their Gini coefficients, crime rates and ethnic heterogeneity. While New Orleans has a higher Gini coefficient, implying higher economic inequality, Philadelphia has a higher crime rate and a more racially and ethnically diverse residential population.
- The largest industry in New Orleans is its Accommodation and Food Service sector, employing 24% of the city’s total workforce.
- Philadelphia’s Accommodation and Food Service sector only accounts for 9% of its total employment. The Health Care and Social Assistance sector dominates in Philadelphia, employing 26% of the total workforce.
- In sum, the Similarity Index shows that Philadelphia has much in common with New Orleans, making it a great location for our 2023 GPLEX cohort to learn about similar issues and possibly new and innovative solutions.
Our Multi-Dimensional Similarity Index
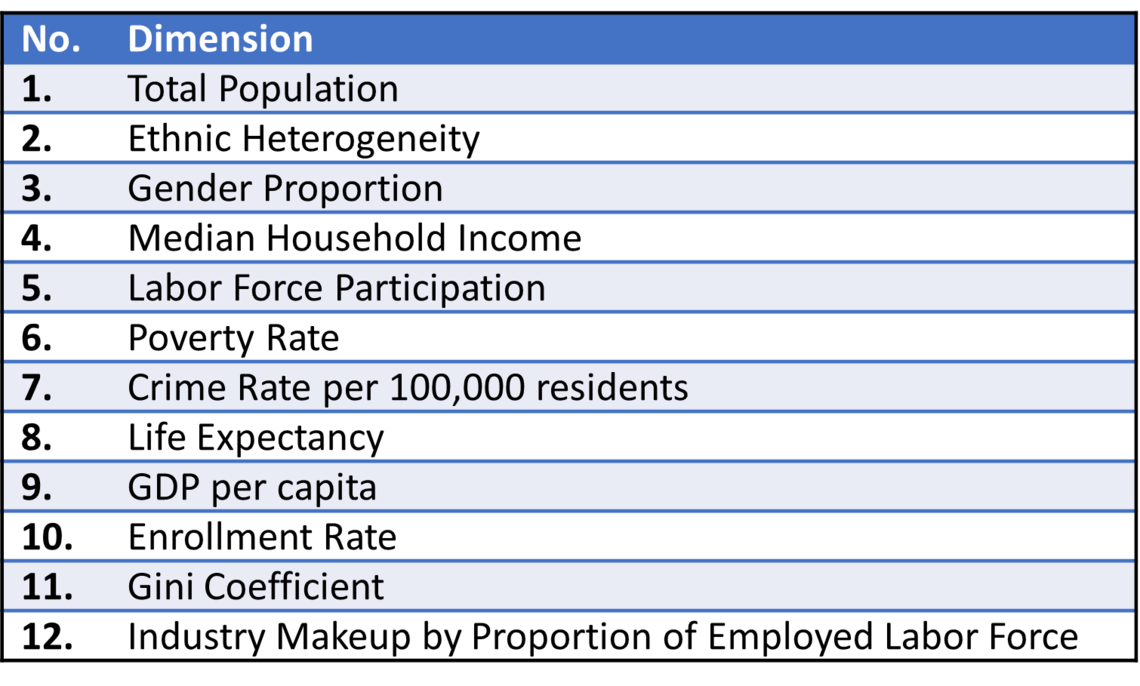
As the Economy League prepares for GPLEX 2023 in New Orleans, we dig into the Similarity Index that we introduced last year to compare the two cities on multiple dimensions. The Similarity Index incorporates 12 socioeconomic factors (see Appendix A for more detail) to benchmark the differences and similarities between cities, taking into account their historical contexts, socioeconomic issues, and different population sizes. Using a multidimensional benchmarking index produces rich and useful comparisons since it accounts for differences and produces a proportional score along different dimensions.
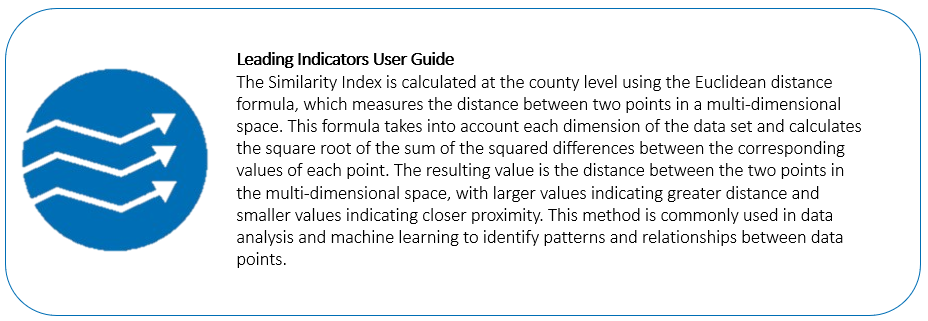
For example, comparing crime rates between different municipalities can be challenging due to the variety of crimes and the fact that areas with higher populations tend to report statistically higher counts and types of crimes committed. However, a multidimensional index can account for these differences by normalizing and equalizing socioeconomic indicators, resulting in more robust geographic comparisons. By using the Similarity Index, we can capture the complex interplay of macroeconomic indicators across different geographic areas, and better understand the similarities and differences between them (See the Leading Indicators User Guide for details on Similarity Index construction).
Philadelphia and New Orleans
Figure 1 shows a radar chart of 11 socioeconomic indicators used in our Similarity Index for the two cities (since Philadelphia County and Orleans Parish are both coterminous with their cities, we will use the word “city” and “county” to describe the two areas interchangeably). Metrics for the Similarity Index were calculated using 2019 estimates [1] for 2,926 counties in our dataset, with each indicator rescaled from 0 to 100 for standardized comparison across counties. For example, the most populous county in our data set would get a score of 100 and the least populous county would get a score of 0. Figure 1 shows that we can get a much better understanding of how different places relate to each other once we take a multi-dimensional approach to comparative analysis. The more similar in shape two different objects are on the radar chart, the more they have in common across measured dimensions. Since the overall shape of the radar chart for New Orleans maps onto Philadelphia across these 11 dimensions quite well, it provides quantitative evidence for a high degree of similarity between the two places. This makes New Orleans a promising place to visit for GPLEX applicants this year.
FIGURE 1
Source: American Community Survey, County Business Patterns, Kaggle, Bureau of Labor Statistics
The radar chart in Figure 1 shows that Philadelphia and New Orleans are closely aligned on most indicators, with both cities scoring similarly on poverty rate and labor force participation as well as GDP per capita, median household income, and life expectancy. Since Philadelphia’s population of 1.6 million is roughly four times that of New Orleans’ population of 390,000, these numbers reflect slightly different but comparable realities across the two cities. For example, Philadelphia’s 23.7% poverty rate is marginally higher than New Orleans’ poverty rate of 22.8%. Thus, despite Philadelphia’s larger population size, the pervasiveness of poverty is comparable across the two cities. Similarly, the median household income in Philadelphia was $45,927 in 2019, slightly higher than New Orleans’ median household income of $41,604. However, the relatively higher cost of living in Philadelphia [2] suggests that the median disposable income of a New Orleans household is similar to that of a Philadelphia household. Despite the higher poverty rate and lower median household income compared to other counties in our analysis, both Philadelphia and New Orleans have relatively high labor force participation rates of 61% and 62% respectively. These estimates are higher than the average labor force participation of 58% in our sample. This multi-dimensional comparison suggests that there may be important learnings for Philadelphia leaders to be gleaned from a wider range of cities than what are usually considered ‘peers’ by population and geography.
Figure 1 also shows a few notable differences between Philadelphia and New Orleans. For example, New Orleans has a higher Gini coefficient, indicating a higher level of income inequality compared to Philadelphia. This could potentially be driven by New Orleans’ predominant tourism industry, where research suggests that white employees hold 71% of higher-paying restaurant jobs, thereby perpetuating inequality across racial lines of difference [3]. From a macroeconomic standpoint, much of New Orleans' recent employment growth has been concentrated in lower-paying sectors like Hospitality, Retail, and Administrative Services, and these sectors have seen little to no real wage growth since 1990. In contrast, while employment in higher-paying sectors such as Oil and Gas as well as Utilities and Manufacturing have remained stagnant, wages in these sectors have increased by 84% since 1990 [4,5].
The Similarity Index also showed that Philadelphia has a higher crime rate and ethnic heterogeneity (i.e., residential diversity) than New Orleans. While both cities score high on crime rate and ethnic heterogeneity compared to other counties in our data set, Philadelphia’s crime rate of 1,150 crimes per 100,000 residents is still higher than most. New Orleans, on the other hand, has a relatively lower crime rate of 782 crimes per 100,000 residents despite similar poverty and income levels in the two cities. This could, in part, be explained by the New Orleans Police Department’s recent adoption of surveillance technologies like drones to monitor crime hotspots [6]. While controversial, increased surveillance may allow for a more active flow of information and response among New Orleans’ criminal justice systems.
Although crime may be more prevalent in Philadelphia, it also hosts a more diverse population when compared to New Orleans. Ethnic heterogeneity is calculated via the Simpson’s Index which takes into account both the racial and ethnic richness as well as evenness of these populations in each region [7]. The larger diversity Philadelphia is largely driven by recent immigration patterns with a higher number of Hispanic, Asian, and multi-racial individuals moving to Philadelphia when compared to New Orleans.
Industry Comparison Across Philadelphia and New Orleans
In addition to the 11 socioeconomic indicators, we also include the industry makeup of the two cities in our Similarity Index. Figure 2 shows the proportional size of major industry sectors by total employment for both Philadelphia and New Orleans. At 24% of the city’s total employment, the Accommodation and Food Service industry is the largest in New Orleans. Philadelphia’s Accommodation and Food Service industry, on the other hand, only accounts for 9% of its total employment. These estimates demonstrate that New Orleans’ economy is heavily dependent on its Accommodation and Food Service sector. Although the Accommodation and Food Service sector in New Orleans is 1.4 times smaller than in Philadelphia in terms of raw size, it employs nearly 2.7 times as many people proportionately.
FIGURE 2
Source: American Community Survey, County Business Patterns, Kaggle, Bureau of Labor Statistics
Health Care and Social Assistance shows the opposite relationship with a higher percentage of Philadelphia’s employment in this industry (26%) when compared to New Orleans (15%). These estimates reflect the high reliance of the Philadelphia economy on its anchor institutions compared to relatively low anchor reliance of New Orleans [8]. Anchor institutions are organizations rooted in place through assets like real estate, infrastructure, and human capital and typically include hospitals and higher education institutions. Our sector comparison in Figure 2 reflects the strong tourism industry in New Orleans and the robust medical care and social assistance industry in Philadelphia. It is important to note, however, that the industry makeup between the two cities is quite similar beyond the largest employers. For example, in both Philadelphia and New Orleans, Educational Services employ a similar proportion of the total workforce at 14% and 12%, respectively. Similarly, Retail Trade and Professional, Scientific and Technical Services each account for approximately 8% of the total employed labor force in both cities.
Looking Ahead
Our multi-dimensional benchmarking index provides a comprehensive picture of the similarity between New Orleans and Philadelphia, suggesting that Philadelphia leaders will have a lot to learn during the 2023 GPLEX conference. With many similarities but a few key differences, we have a great opportunity to center our GPLEX discussions around common issues and compare different solutions. As we gear up for GPLEX 2023, we will continue to expand and refine our Similarity Index to produce more robust comparisons between the two cities.
Works Cited and Notes
[1] 2019 is the most recent year we could find estimates across all indicators in our analysis. In some cases, we had to use the 5-year estimates between 2015-2019 to create the multi-dimensional index.
[2] “2023 Cost of Living Calculator: compare New Orleans, Louisiana to Philadelphia, Pennsylvania,” https://www.bestplaces.net. https://www.bestplaces.net/cost-of-living/new-orleans-la/philadelphia-p… (accessed Apr. 11, 2023).
[3] “How the New Orleans tourism industry perpetuates its glaring racial wealth gap,” Jul. 15, 2021. https://www.tennessean.com/in-depth/news/american-south/2021/07/15/how-… (accessed Apr. 11, 2023).
[4] C. S. Ng Amy Liu, Natalie Holmes, and John, “Opportunity clusters: Identifying pathways to good jobs in metro New Orleans,” Brookings, Nov. 30, 1AD. https://www.brookings.edu/research/opportunity-clusters-identifying-pat… (accessed Apr. 11, 2023).
[5] “An Equity Profile of New Orleans.” https://nationalequityatlas.org/find-resources/new-orleans-equity-profi… (accessed Apr. 11, 2023).
[6] F. 8 Staff, “Supt. Woodfork announces strategic plan to help NOPD combat the violent crime in New Orleans,” https://www.fox8live.com, Feb. 03, 2023. https://www.fox8live.com/2023/02/03/supt-woodfork-announces-strategic-p… (accessed Apr. 11, 2023).
[7] Zach, “Simpson’s Diversity Index: Definition & Examples,” Statology, Mar. 29, 2021. https://www.statology.org/simpsons-diversity-index/ (accessed Nov. 28, 2022).
[8] “Anchor Economy Dashboard.” https://www.philadelphiafed.org/surveys-and-data/community-development-… (accessed Apr. 11, 2023).
APPENDIX A
"The Economy League's Leading Indicator article serves as a high-quality analysis to deepen understanding of key regional trends and labor market challenges based on publicly available data. Have any questions or additional input on this week's topic? Send us your thoughts at [email protected]."