Test Driving the Anchor Economy Dashboard
For years, hospitals and universities have been regarded as key players in regional economies. While corporate headquarters and manufacturing facilities may relocate to reduce costs, these so-called ‘anchor institutions’ are rooted in place through assets like real estate, infrastructure, and human capital. This attachment to place incentivizes such institutions to invest in the neighborhoods and communities in which they are located. Moreover, hospitals and universities tend to not only employ large numbers of people, but they also tend to be less susceptible to recession, and thus help to stabilize regional economies [1]. As many of these anchor institutions are resource- and knowledge-rich, they have the potential to drive significant growth and innovation in their home regions. Yet there remains an important debate on the scope and nature of the impact that anchors have on their regional communities.
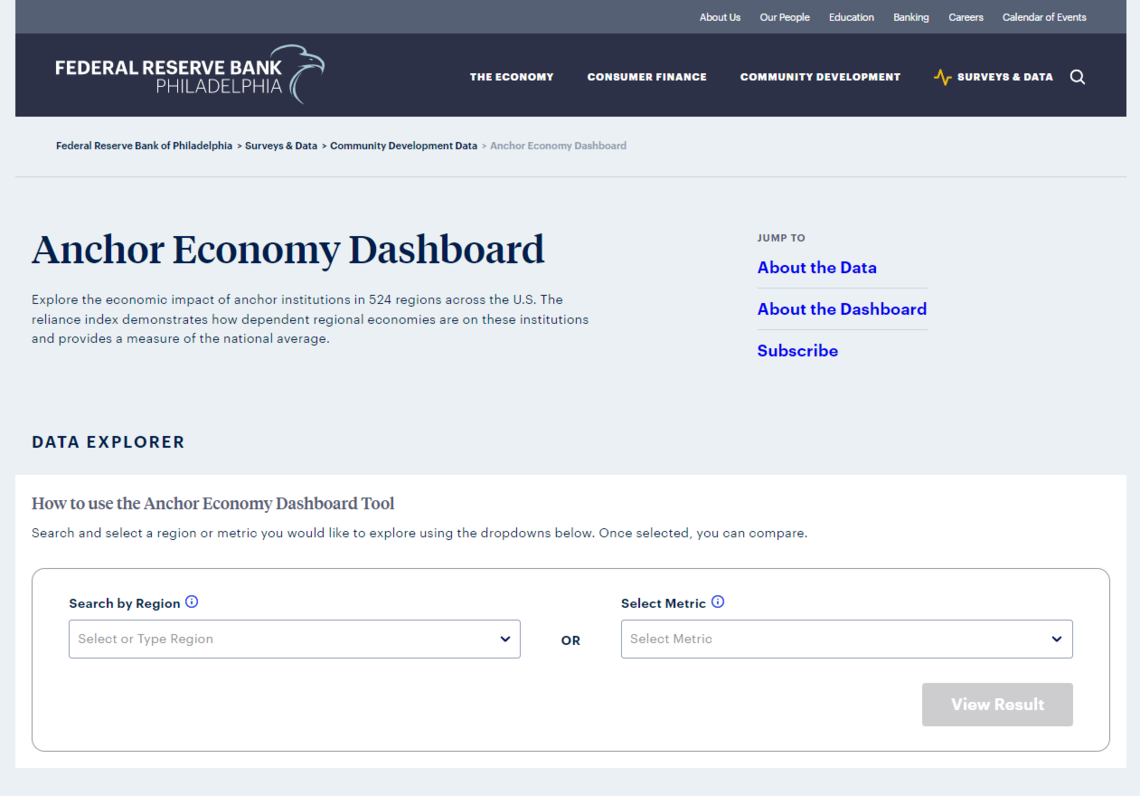
To help practitioners, policymakers, and business leaders better understand the significance of anchor institutions to a region’s economy, the Anchor Economy Initiative at the Federal Reserve Bank of Philadelphia (FRBP) has created the Anchor Economy Dashboard (AED), a first-ever national dataset and website (seen in Figure 1). The Anchor Economy Initiative is focused on hospital and university anchors as critical partners in regional economic and community development. As the backbone organization for the anchor collaborative called PAGE (Philadelphia Anchors for Growth & Equity), the Economy League was eager to explore this resource. In this week’s Leading Indicator, we test drive the AED to see what it can tell us about Greater Philadelphia’s anchor economy.
FIGURE 1
What You Need to Know
- The Anchor Economy Initiative at the FRBPeral Reserve Bank of Philadelphia (FRBP) has created the Anchor Economy Dashboard (AED), a first-ever national dataset and website to help practitioners, policymakers, and business leaders better understand the significance of anchor institutions to a region’s economy.
- The AED data captures the quantitative impact of anchor institutions on their regional economies through employment, income, and gross value-added (GVA). These impact indicators are further used to create the Reliance Index for 524 regions in the U.S.
- At the national level, anchor institutions generate a total impact of more than 18 million jobs, $1.1 trillion in income, and $1.7 trillion in GVA.
- Anchor institutions in Greater Philadelphia produce 12.8% of total employment, 8.4% of total income, and 11.4% of total GVA.
- Greater Philadelphia’s economy ranks 5th for anchor employment and employment impact amongst the other 124 metropolitan regions with resident populations of 500,000 or more.
- There is a slightly positive correlation between access to health and education and a regional economy’s reliance on its anchor institutions.
Anchor Data Description
The Anchor Economy Dashboard (AED) dataset looks at 24,155 hospital and universities across 524 metropolitan and non-metropolitan regions throughout the U.S. (The data are from 2019 - the most recent year unaffected by the COVID-19 pandemic.) The FRBP worked with Oxford Economics—an international economic advisory firm—to create an input and output model demonstrating how regional economic landscapes are shaped by anchor institutions. The model’s inputs—quantifying the size and activity of the anchors—include employment, wages, operational spend, capital spend, and ancillary spend, while outputs such as direct, indirect, and induced employment, income, and gross value-added (GVA) help to define anchors’ economic contributions.
While the input-output model described above quantifies anchor impact in absolute terms, the Reliance Index provides a summary of how economically dependent a regional economy is on its anchor institutions, relative to the nation’s dependence on anchor economies. The Reliance Index takes an average of the share of output indicators (i.e., employment, income, and GVA) in each region and divides that number by the national average of those same three indicators. In the AED dataset, the Reliance Index ranges from 0.7 to 3.7, where 1.0 represents the reliance of the national economy on its anchor institutions. Thus, any metropolitan region with a score greater than 1.0 is more economically reliant on anchor institutions when compared to the national economy. This index allows for an objective comparison of the role of anchors in regional economies of various sizes.
Impact of Anchor Institutions in Regional Economies
To further explore the quantitative power behind the FRBP’s AED, we set up a simple comparative analysis of the Reliance Index across large metropolitan regions in closer proximity to Greater Philadelphia. Figure 2 shows how much anchor institutions contribute towards their local economies in terms of employment, income, and GVA contribution. This impact includes direct, indirect, and induced contribution by anchor institutions for each indicator. Direct impact includes direct purchases and employment by hospitals and higher education institutions. Indirect impact results from the additional purchases and hiring businesses in anchor institutions’ supply chain conduct. Induced impact, on the other hand, captures economic activity of stakeholders tied to anchor institutions in a direct or indirect capacity [2]. At the national level, the total economic impact of anchor institutions is approximately 9% of total U.S. employment, 6.3% of total U.S. income, and 8.1% of total U.S. GVA. These national levels are shown by vertical blue lines in Figure 2.
FIGURE 2
Source: Anchor Economy Dashboard, provided by Federal Reserve Bank of Philadelphia
Anchor institutions in Greater Philadelphia play a larger role in its regional economy when compared to the national average, whereby anchors contribute 12.8% of total employment, 8.4% of total income and 11.4% of total GVA. We compare Greater Philadelphia to large metropolitan regions across the Eastern U.S. who share geographic and/or demographic trends. Of these 7 regions, including Greater New York City, Greater Boston, Greater Washington D.C., Greater Atlanta, Greater Pittsburgh, and Greater Baltimore, Greater Boston is the only region where anchor institutions have a greater impact on the regional economy than Greater Philadelphia. This might be because of a larger concentration of higher education institutions as well as medical schools and hospitals in Greater Boston [3], [4]. Anchor institutions in the metropolitan regions of Atlanta and Washington D.C., on the other hand, have a lower economic impact compared to the national average. A high concentration of the labor force working in Federal government jobs in Washington D.C. [5] and the strong market for private businesses in Atlanta [6] might explain the lower economic reliance of anchor institutions in these regions.
We also compare the Reliance Index for Greater Philadelphia and its peer metropolitan regions in Figure 3. A Reliance Index score of 1 indicates that the economic impact of anchor institutions in the regional economy is equal to the national average. Any score above 1 indicates that anchor contributions in a region are higher than the national average and while a score lower than 1 means that anchor contributions are less than the national average. Once again, Greater Philadelphia ranks second with a reliance score of 1.4 in having the highest contribution of anchor institutions towards its local economy. Greater Boston has a slightly higher reliance score of 1.5, whereas Greater Washington D.C., Greater Atlanta and Greater New York City all have reliance scores below the national average.
FIGURE 3
Source: Anchor Economy Dashboard, provided by Federal Reserve Bank of Philadelphia
Avenues for Future Research
The AED data offers promising avenues of future research for policymakers and academic practitioners. Our analysis already highlights the unique comparative insights on the economic impact of anchor institutions that can be gained through the AED dashboard. However, there are several indicators within the AED data that can be further used to understand the impact of anchor institutions. Figure 4, for example, shows a correlation between the Reliance Index and access to health and higher education, where access is an approximate measure of the supply of these services. The AED collects information on hospital and higher education establishments, like number of hospital beds and surgical procedures as well as enrollment and degree completions from higher education institutions. We took an average of these measures to calculate health and higher education access, respectively.
FIGURE 4
Source: Anchor Economy Dashboard, provided by Federal Reserve Bank of Philadelphia
The positive correlation, especially for higher education access, shows that access to health and higher education tends to increase with the level of reliance an economy has on its anchor institutions. This does not mean that greater economic impact of anchor institutions leads to greater access to higher education and health, but it does call for future research that can further uncover this relationship—something which would not have been possible without the AED data.
In addition to its comprehensive internal metrics, the AED also has the capacity to be merged with socioeconomic indicators from publicly available databases, like the American Community Survey and Bureau of Labor Statistics. Combining the information on anchor institutions with additional metrics can shed light on relationships between the economic impact of anchor institutions and regional stability and equitable distribution of resources. The AED data can also uncover the levels of community development in regions where reliance on anchors is higher. We will explore these future avenues of research derived from the AED data in future leading indicators as well.
Conclusion
Data provided in the AED underscores that Philadelphia-based anchor institutions have a significant impact on the regional economy. The data resources and metrics provided by the Philadelphia Fed offer an important first look into how policymakers and legislators can use data to better understand the impact anchor institutions on local employment and business procurement. The Economy League’s PAGE initiative strives to understand the best ways to leverage these data to inform our anchors and local leaders about how they can invest in their regional economies to drive equitable and inclusive outcomes. Especially when used in conversation with other metrics, the data collected by the FRBP’s Anchor Initiative can assist us in shaping and developing opportunities for further research on this and many more topics.
Works Cited
[1] I. H. and H. Zuckerman, “Eds and Meds: Cities Hidden Assets,” Brookings, Nov. 30, 1AD. https://www.brookings.edu/research/eds-and-meds-cities-hidden-assets/ (accessed Oct. 31, 2022).
[2] P. Harker, D. Diamond, and D. Reed, “Understanding the Role of Higher Education and Hospitals in Regional Economies,” p. 40.
[3] Medbelle, “2019 Hospital City Ranking USA,” Medbelle. https://www.medbelle.com/best-hospital-cities-usa/ (accessed Oct. 31, 2022).
[4] “America’s Biggest College Towns,” Bloomberg.com, Sep. 08, 2016. Accessed: Oct. 31, 2022. [Online]. Available: https://www.bloomberg.com/news/articles/2016-09-08/america-s-biggest-co…
[5] “Business in Washington D.C. | Industry Insights,” North America Outlook Magazine. https://www.northamericaoutlookmag.com/industry-insights/article/25-bus… (accessed Oct. 31, 2022).
[6] C. Turner, “Four Thriving Industries in Metro Atlanta in 2020 and Beyond,” Atlanta Small Business Network, Feb. 03, 2020. https://www.myasbn.com/small-business/business-news-trends/four-thrivin… (accessed Oct. 31, 2022).