Inflation in Greater Philadelphia – Part 1: De-Mystifying Local Inflation
As Greater Philadelphia’s economy slowly emerges from the impact of the COVID-19 pandemic, inflation has become a growing concern. The pandemic-induced economic lockdowns caused major supply chain disruptions across the globe that will have a long-term impact on the price of goods and services. Since increasing prices and diminished purchasing power can inhibit economic recovery, it is imperative that policymakers and civic leaders understand the impact inflation will have on local populations. This Leading Indicator opens a series exploring how inflation can affect the everyday lives of Greater Philadelphia’s residents. The first part of this series opens with an overview for understanding and measuring inflation followed by how it will particularly impact prevailing economic trends in Greater Philadelphia.
Key Takeaways
- Inflation is a rise in general prices over time that decreases consumers’ purchasing power.
- To measure inflation, the U.S. Bureau of Labor Statistics created the Consumer Price Index (CPI). The CPI gives a weighted average measure of the change in prices in a combined “basket of goods and services.”
- Greater Philadelphia’s CPI has been steadily rising since the early 1980s. An item in Greater Philadelphia worth $100.00 in the early 1980s was worth $158.90 by 2020.
- Inflation rates are also a useful metric for understanding inflation trends since they measure the change in the CPI between two different time periods (often months or years).
- The pressure on global supply chains caused by the COVID-19 pandemic pushed Greater Philadelphia’s inflation rate in June 2021 nearly five percent higher than it had been the prior year.
- The rise in prices for necessity items is a great concern for Greater Philadelphia since the region is hampered by stagnant wage growth and a high concentration of poverty.
- By August 2021, Greater Philadelphia’s CPI had grown by 17.8 percent from its February 2011 value; in the same period, the region’s average hourly wage grew by only eight percent.
Understanding and Measuring Inflation
Simply put, inflation is a rise in general prices over time that effectively decreases consumers’ purchasing power. Continued inflation—where prices keep climbing but wages and savings remain the same—can make the cost-of-living unaffordable for large swaths of the population. This is why many economists and government officials spend a great deal of time tracking and predicting inflation rates.
To measure inflation, the U.S. Bureau of Labor Statistics created the Consumer Price Index (CPI). The CPI gives a weighted average measure of the change in prices in a combined “basket of goods and services.” This basket is comprised of food and beverages, housing, apparel, transportation, healthcare, recreation, education and communication, and other non-specific goods and services like haircuts, personal care products, and funeral expenses [1]. Figure 1 shows the growth of Greater Philadelphia’s CPI from 1982 to 2020.
FIGURE 1
SOURCE: Consumer Price Index for all Urban Consumers (CPI-U) within the Philadelphia-Camden-Wilmington, PA-NJ-DE-MD from the U.S. Bureau of Labor Statistics
Since the CPI measures the average change in prices over time, it is used as a proxy metric for determining relative cost of living. Current CPI numbers are indexed to calculate the average change in prices since the combined period of 1982 to 1984. So, the CPI in 2020, at 258.9, means that general prices in 2020 were 158.9 percent greater than in the baseline 1982 to 1984 period, or that an item in Greater Philadelphia worth $100.00 in the 1982-84 period was worth $158.90 by 2020.
Inflation rates are also a useful metric for understanding how the CPI has changed over time. An inflation rate measures the change in the CPI between two different time periods (often months or years). Figure 2 shows that annual inflation rates in Greater Philadelphia and the U.S. significantly increased as a result of the COVID-19 pandemic. In fact, by June 2021, the inflation rate in Greater Philadelphia was 4.9 percent greater than it had been in June 2020. Policymakers and economist view mild inflation rates (at or below two percent) as healthy for a growing economy [2]; those that exceed the two percent threshold—like those shown in the latter half of figure 2—can devastate an economy if they remain high for an extended period. High inflation rates mean higher prices for everyday goods which can make the cost-of-living unaffordable for those with lower to moderate incomes.
FIGURE 2
SOURCE: Consumer Price Index for all Urban Consumers (CPI-U) within the Philadelphia-Camden-Wilmington, PA-NJ-DE-MD and the U.S. City Average from the U.S. Bureau of Labor Statistics
Inflation in Greater Philadelphia
While a number of factors can contribute to inflation, the economic lockdown induced by the COVID-19 pandemic resembles “demand-pull inflation” or when the short supply of goods drives up pricing [3]. As supply chains were disrupted because of closures and stay-at-home mandates, there was greater demand for fewer goods. The rise in prices of necessity items is a great concern for Greater Philadelphia since the region suffers from stagnant wage growth and a high concentration of poverty.
Stagnant wage growth has been a persistent issue for Greater Philadelphia. We have previously discussed how much of the recent regional employment gains of the past decade have come from foundational-level, low-wage jobs in service industries. Figure 3 shows that the growth of Greater Philadelphia’s CPI has largely outpaced that of the region’s average hourly wage, in real dollars, from February 2011 to August 2021. By August 2021, the CPI had grown 17.8 percent from its value in February 2011 while the region’s average hourly wage was only eight percent higher; thus, the prices for everyday items grew faster than workers’ average wages. If wages continue to lag behind inflated prices of everyday necessities—like food, housing, transportation, or healthcare—then the region will face a growing unaffordability gap.
FIGURE 3
SOURCE: Consumer Price Index for all Urban Consumers (CPI-U) within the Philadelphia-Camden-Wilmington, PA-NJ-DE-MD and the Average Hourly Wage from the U.S. Bureau of Labor Statistics
Paralleling stagnant wages is the region’s high concentration of poverty. As figure 4 shows, Greater Philadelphia has the fifth highest concentration of impoverished residents among the ten largest metropolitan regions in the country.
FIGURE 4
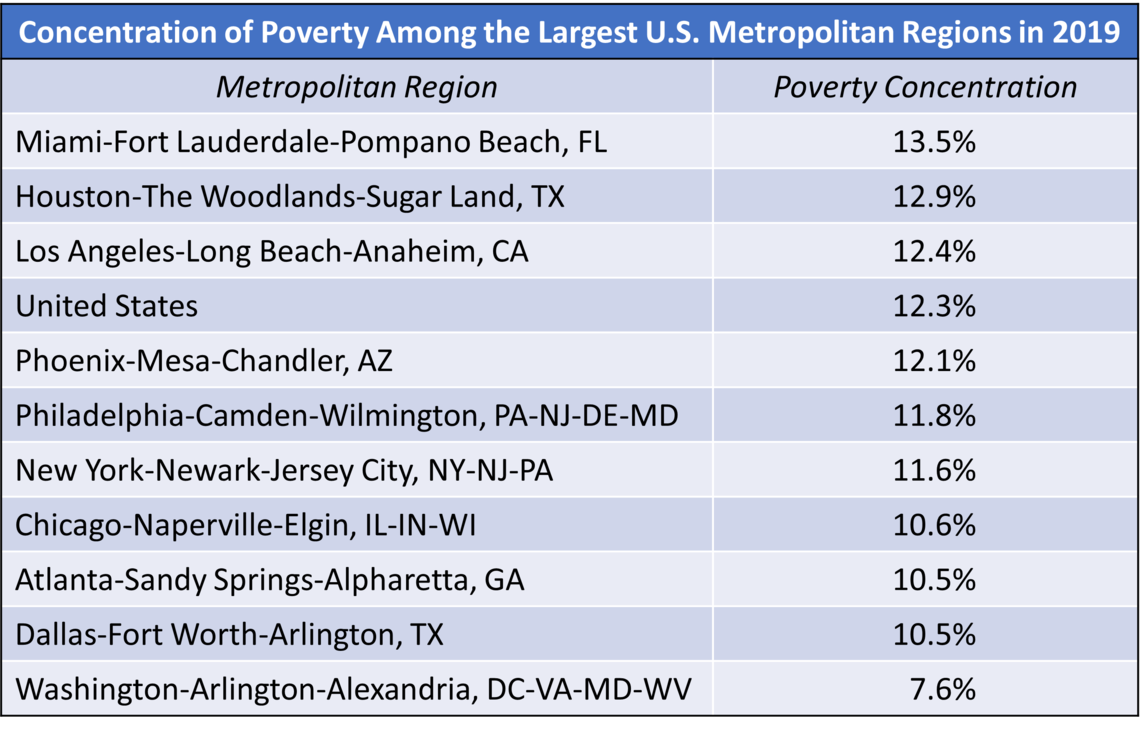
SOURCE: U.S. Census Bureau’s 2019 American Community Survey
Although inflation’s relationship with poverty is complicated, previous research demonstrates that it has the greatest impact on those in the lowest income brackets [4]. On one hand, it further reduces their already limited purchasing power for basic necessities. On the other hand, it can spark greater relief initiatives, like the previous COVID stimulus payments and the Child Tax Credit, meant to pour more money back into the economy. The issue is that while these stimulus initiatives can pull people out of poverty, they may increase inflation since the increased money flowing in the economy is still competing over the same amount of limited goods. Thus, Greater Philadelphia may see multifaceted impacts in relation to inflation.
Going Forward
With an array of impacts and driving forces related to inflation in Greater Philadelphia, we will be diving deeper into understanding both the components and long-lasting effects. This opening piece serves as our foundation for de-mystifying inflation as a real economic outcome that will affect Greater Philadelphia’s economic recovery going forward.
Want to learn more about inflation in Greater Philadelphia?
Read the next piece in our series here
Works Cited
[1] U.S. Bureau of Labor Statistics. 2021. “Consumer Price Index Frequently Asked Questions.” U.S. Bureau of Labor Statistics. Retrieved from: (https://www.bls.gov/cpi/questions-and-answers.htm).
[2] Board of Governors of the Federal Reserve System. 2011. “Current FAQs: What is an acceptable level of inflation?” Federal Reserve. Retrieved from: (https://www.federalreserve.gov/faqs/5D58E72F066A4DBDA80BBA659C55F774.htm).
[3] Gordon, Jason. 2021. “Demand Pull Inflation – Explained.” The Business Professor. Retrieved from: (https://thebusinessprofessor.com/en_US/economic-analysis-monetary-policy/demand-pull-inflation-definition).
[4] Jaravel, Xavier. 2019. “The Unequal Gains from Product Innovations: Evidence from the U.S. Retail Sector.” The Quarterly Journal of Economics, 134(2): 715-783. Retrieved from: (https://academic.oup.com/qje/article/134/2/715/5230867?login=true).