Restaurant Revitalization Funds in Philadelphia
As part of the American Rescue Plan Act in March 2021, the U.S. Congress allocated $28.6 billion to the Small Business Administration (SBA) to aid food or drink establishments that had lost revenues as a result of the COVID-19 pandemic. The program provides funds for establishments where “the public or patrons assemble for the primary purpose of being served food or drink” and saw a decline in gross receipts between $1,000 and $5,000,000 per location from 2019 to 2020 [1]. In this Leading Indicator we take a closer look at the distribution of these Restaurant Revitalization Funds (RRF) in Philadelphia using data released by the SBA on July 12, 2021.
For the 3,846 Philadelphia food services and drinking places establishments - as estimated by the U.S. Bureau of Labor Statistics [2] - the RRF and local initiatives such as the City of Philadelphia’s COVID-19 Small Business Relief Fund have been essential to keeping these businesses financially afloat throughout the pandemic. These programs may also see renewal as concerns grow around a stalled economic recovery due to the spreading delta variant of the COVID virus. The need for relief is even more pressing in areas like University City and sections of Center City where over 20 percent of all business establishments are in the accommodation and food services sector, and where the normal consumer base of office workers and students remains diminished.
Key Takeaways
- In Philadelphia, 727 food and drink establishments were approved for Restaurant Revitalization Funds (RRF), receiving a total of $268,038,724 in grants.
- The total number of 727 Philadelphia’s RRF recipients represents roughly 19 percent of the city’s total estimated food services and drinking places as of 2020.
- The median RRF grant amount in Philadelphia was $166,111.00, with 75 percent of all recipients receiving less than $370,344.
- Only one business in Philadelphia received the maximum grant amount of $10,000,000.
- Full-service restaurants comprised roughly 60 percent of all RRF recipients in Philadelphia.
- While catering businesses comprised only 6 percent of all RRF recipients in Philadelphia, they accounted for the largest average RRF grant amount at $587,000.
- Of the total number of RFF recipients, 39 percent identified as women-owned businesses.
- Only two percent of RFF recipients in Philadelphia identified as veteran-owned.
- Roughly 46 percent of RFF grants went to socioeconomically disadvantaged businesses (as defined by the SBA), and 28 percent went to businesses in low- or moderate-income areas.
- Normalizing the RRF’s coverage rate (the proportion of RRF recipients to the total estimate of food and accommodation establishments), suggests a large disparity among Philadelphia’s zip codes – with some areas seeing RRF coverage rates as high as 20 percent while others saw only two percent coverage.
- Normalizing average RRF grant amounts across Philadelphia’s zip codes, four of the five top RFF zip codes were in Center City; however, the highest average grant amount, $99,757, was found in the 19126 zip code, a north central section of the city that includes Oak Lane.
General Patterns
In Philadelphia, 727 food and drink businesses were approved for RRF grants, representing approximately 19 percent of the city’s total estimated food services and drinking places as of 2020 [2]. A total of $268,038,724 in grants were allocated to these businesses. As shown in figure 1, the majority of grants awarded were under $1,000,000 with a median amount of $166,111 per recipient, with 75 percent of all recipients receiving under $370,344.
FIGURE 1
SOURCE: U.S. Small Business Administration
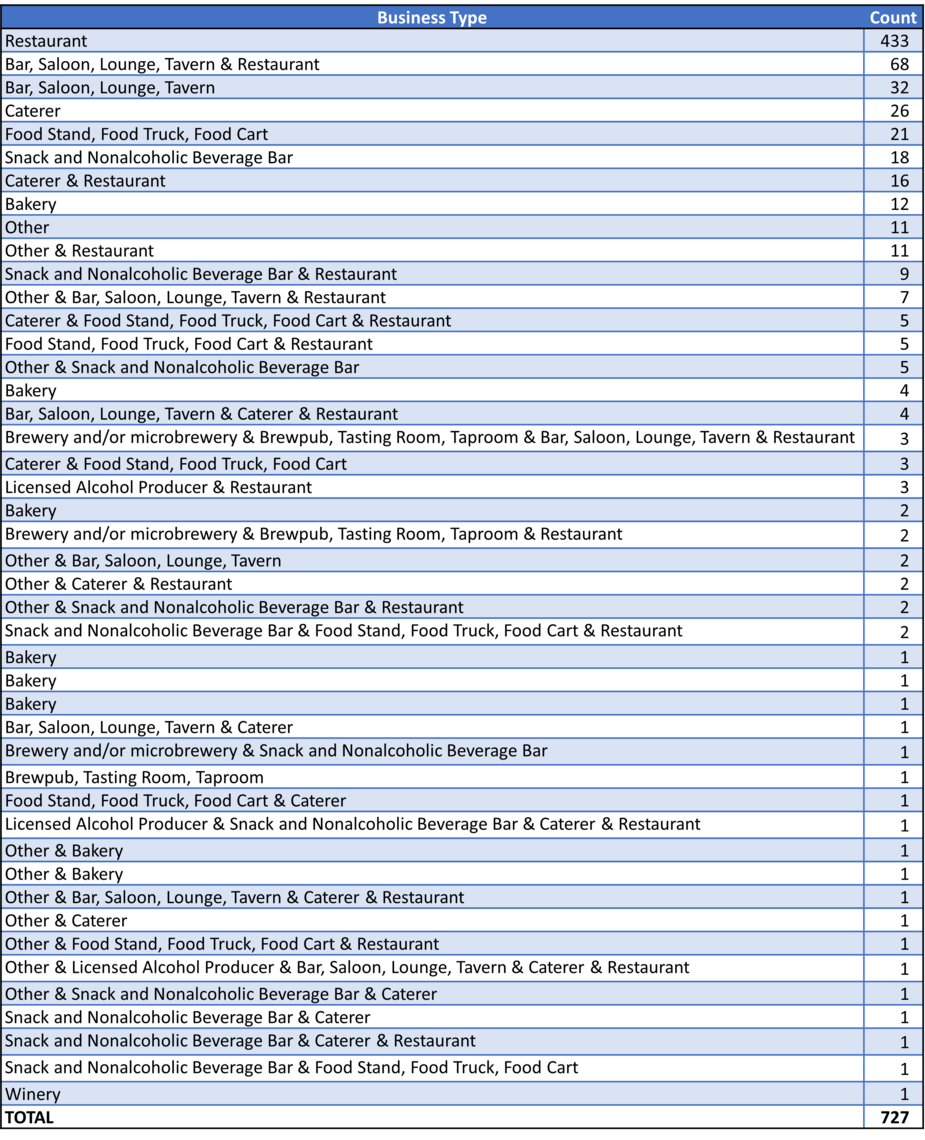
Broken down by business type, restaurants made up the lion’s share of RRF grant recipients, comprising roughly 60 percent of all businesses receiving funds (as detailed in figure 2). The next largest group of recipients was categorized by the SBA as “Other” or business types with fewer than ten businesses in Philadelphia (14%) (see appendix for the full list of business types used in the data). The “Other” group was followed by Bar-Restaurants (9%), Caterers (6%), Bar, Saloon, Lounge, Taverns (4%), then Food Stands, Food Trucks, Food Carts (3%), Snack or Nonalcoholic Beverage Bars (2%) and finally Bakeries (2%).
FIGURE 2
SOURCE: U.S. Small Business Administration
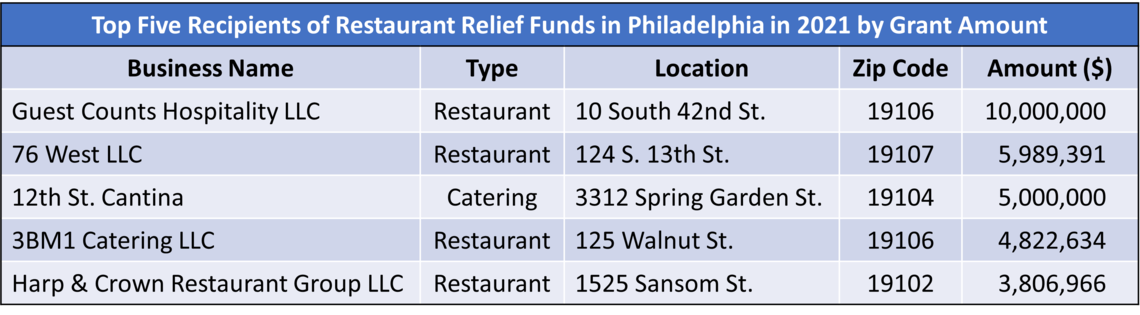
The average grant amount per individual business varied significantly by business type (as detailed in figure 3). Expectedly, businesses with lower operating costs or lower-profit inventory received less funds, reflecting smaller losses in sales. Food trucks and snack bars, for instance, were awarded on average $130,554.50 and $150,935.00 respectively, in comparison to the average $382,952.90 allocated per full-service restaurant. Businesses serving alcohol also appear to have received more funds on average, with combined bar and restaurants receiving $486,917.20 per business. The average award per business was by far the highest for caterers at $586,659.90, possibly reflecting the magnitude of revenue lost from special events during the pandemic. In fact, figure 4 shows that the top five recipients of the largest RRF amounts in Philadelphia were catering and full-service restaurants – with the top recipient, an Old City restaurant, receiving almost 1.7 times the amount of the next highest recipient.
FIGURE 3
SOURCE: U.S. Small Business Administration
FIGURE 4
SOURCE: U.S. Small Business Administration
Although the RFF was meant to prioritize minority- and women-owned businesses, the proxy metrics constructed by the SBA show that businesses in low- to middle-income areas were largely underrepresented. Figure 5 shows demographic characteristics of RRF recipients in Philadelphia. Of the total number of recipients, 39 percent identified as women-owned businesses, 2 percent identified as veteran-owned, 46 percent went to socioeconomically disadvantaged businesses, and 28 percent went to low- or moderate-income businesses. Businesses self-identified into these demographic groups, except for low-or moderate-income businesses which were classified by the SBA based on business location [3]. With fewer than a third of the total grants going to businesses in low- or middle-income neighborhoods, there seems to have been a disparity in grant allocation in Philadelphia.
FIGURE 5
SOURCE: U.S. Small Business Administration
Neighborhood Trends
To further uncover geographic disparities of RRF allocation in Philadelphia, figure 6 details the distribution of RRF by zip code while also normalizing the grant coverage rate and average grant amount using 2019 Food and Accommodation establishment estimates from the U.S. Census Bureau.
FIGURE 6
SOURCE: U.S. Small Business Administration and the U.S. Census Bureau’s 2019 County Business Patterns
NOTE: The U.S. Census Bureau’s 2019 County Business Patterns survey does not list any establishments in the NAICS accommodation and food services sector for zip code 19110 in Center City. The map does not include calculated values for RRF coverage rates or grant amount per establishment for this zip code.
Unsurprisingly, neighborhoods with large numbers of establishments in the food and accommodation sector also saw the highest number of grants awarded. In fact, the same five zip codes with the highest estimates of food and accommodation sector establishments in 2019 had the highest number of businesses receiving RRF grants in 2021. Of these zip codes, three were in Center City (19103, 19104, 19107), one in the adjacent zip code covering the Bella Vista and Queen Village neighborhoods (19147), and the last in University City (19104). The same zip codes in Center City and University City, with the addition of 19102, round out the list of zip codes receiving the greatest total amount of funds in Philadelphia.
Normalizing both the number of grant recipients and the amounts awarded by the estimate of food and accommodation establishments in each zip code, however, reveals allocation patterns that are less geographically confined. These numbers revealed a wide gulf in RRF coverage rates across Philadelphia, with some areas seeing RRF coverage rates as high as 20 percent while others saw only two percent coverage. Of the five zip codes with the highest coverage rates, only one was in Center City (19107) and one in University City (19135), with the others located in outlying areas, like Mount Airy (19119), Oak Lane (19126) and Overbrook (19151). Areas of the city with the lowest coverage rates were largely concentrated in North and Northeast Philadelphia, with less than a four percent RRF coverage rate in Bridesburg (19137), Cedarbrook (19150), West Oak Lane (19138), Torresdale (19114) and Tacony (19135).
To assess how the amount of funding available to food establishments varied across the city, we proportioned the combined awarded amounts for each zip code by the total number of estimated food and accommodation establishments. With a concentration of high-volume and high-end venues, Center City was unsurprisingly the location of four of the five top performing zip codes for this metric. Oak Lane (19126), however, had the highest average grant amount of $99,757. The zip codes with the lowest average grant amounts were in North and West Philadelphia in the neighborhoods of Logan (19141), Fairhill (19133), Strawberry Mansion (19132), Bridesburg (19137) and Walnut Hill (19139).
Conclusion
Distribution totals, both in the count and total amount of RRF grants awarded, confirm the predominance of Center City and University City as center of the food and accommodation industry in Philadelphia, and shed light onto the scale of the pandemic’s economic impact in these areas. Additionally, the high allocation rates for catering businesses also indicate the scale of lost income caused by the decline in special events and large gatherings since 2020.
Less obvious, however, is the disparity in access to RRF help across Philadelphia’s neighborhoods revealed by the data. The vast difference in the percentage of food and accommodation establishments receiving support from the RRF indicate that businesses in certain parts of the city, particularly North, Northeast, and West Philadelphia, face significantly more hurdles in accessing economic recovery resources. These data bear out findings from both our original coverage of allocated PPP loans in Philadelphia as well as an earlier report from the Philadelphia Business Journal, which show that a significantly smaller percentage of businesses in high-poverty areas received funds from COVID relief programs. These data alone do not provide a complete explanation for the divide between neighborhoods, but as policymakers work towards revitalizing Philadelphia’s economy after the pandemic, or minimizing damage from a possible resurgence, it is clear that businesses outside the city’s economic center are struggling to access the tools being made available. Helping businesses to return to normal may rely less on increasing the amount of money available, and more on helping underrepresented business owners identify and secure existing funds.
Works Cited
[1] “Restaurant Revitalization Funding Program Guide as of April 28, 2021” | U.S. Small Business Administration | https://www.sba.gov/document/support-restaurant-revitalization-funding-program-guide
[2] “Number of Establishments in Private NAICS 722 Food services and drinking places for All establishment sizes in Philadelphia County, Pennsylvania, NSA” | Bureau of Labor Statistics’ Quarterly Census of Employment and Wages | https://www.bls.gov/cew/data.htm
[3] “Restaurant Relief Fund Data Dictionary” | U.S. Small Business Administration | https://data.sba.gov/dataset/rrf-foia
[4] “Delta Impact Increasingly Threatens Some Parts of U.S. Economy” | Bloomberg | August 5, 2021 | https://www.bloomberg.com/news/articles/2021-08-05/delta-impact-increasingly-threatens-some-parts-of-u-s-economy
[5] “Center City office vacancy rates are increasing. The problem is partly, but not only, low vaccination rates” | Technical.ly | August 23, 2021 | https://technical.ly/philly/2021/08/23/center-city-office-vacancy/
[6] “Philadelphia businesses in high-poverty areas awarded less in Covid-19 relief funds, report finds” |Philadelphia Business Journal | June 24, 2020 | https://www.bizjournals.com/philadelphia/news/2020/06/24/report-businesses-in-high-poverty-neighborhoods.html
APPENDIX