Evictions in Philadelphia: A Review of Eviction Lab’s Data
This article was upated and amended on 16 August 2021.
On August 3, President Biden announced an extension of the Center for Disease Control’s national moratorium on evictions, which was put in place in September 2020 to prevent a nation-wide surge in evictions. Originally set to expire on July 31, the moratorium has been extended until October 3, 2021 and applies to areas with a “high” or “substantial” level of community transmission, a threshold met by 80 percent of U.S. counties and 29 of Pennsylvania’s 67 counties, including Philadelphia. In this week’s Leading Indicator, we highlight the Eviction Tracking System of Princeton University’s Eviction Lab to better understand the moratorium’s impact on evictions in Philadelphia.
Key Takeaways
- Prior to the COVID-19 pandemic, Philadelphia ranked fourth in total eviction filings among the largest U.S. cities.
- With both local and federal moratoriums in place to curb evictions during the pandemic, Philadelphia has significantly decreased its eviction filings.
- Since April 2020, the number of eviction filings in Philadelphia have remained below 40 percent of its 2016-2019 monthly averages.
- As of July 31, 2021, Philadelphia’s monthly eviction filings were 77 percent below its 2016-2019 monthly averages.
- Philadelphia’s majority Black neighborhoods saw the highest number of eviction filings prior to the pandemic as well as the fastest rise in filings since March 2020.
Eviction Lab
The Eviction Lab is a research organization at Princeton University that collects and analyzes national eviction data with the hope of addressing issues related to housing affordability and economic mobility. Eviction Lab provides data and insights that support policymakers, community organizers, and journalists addressing poverty and housing affordability. Since the start of the COVID-19 pandemic, the organization has been building a new data infrastructure to monitor evictions in real time and has made their data and findings publicly available. The Lab’s Eviction Tracking System, featured in this week’s Leading Indicator, collects and analyzes data from eviction court filings for six U.S. states and 31 cities, including Philadelphia. While somewhat varied across geographies, their data allows users to explore current and historic eviction rates.
National Eviction Trends
Eviction Lab’s Eviction Tracking System visualizes eviction filing data with a series of interactive graphs that represent a city or state report card. These report cards detail total eviction filing counts for each week, summed eviction filings per month, as well as baseline historical averages. The tracker’s primary graph overlays a timeline of local and federal moratoriums with eviction filing trends by week, providing insight on the impact of federal, state, or local policy on citywide (or statewide) eviction filing counts (as seen in figures 1 and 2). Examining these weekly eviction filings graphs shows a similar pattern across most U.S. cities: the volume of eviction filings drops sharply in March 2020, as many cities enacted temporary freezes on evictions at the start of the COVID-19 pandemic, then begins to swing upwards by the summer months of 2020 as many of these measures expired - with the exception of Minneapolis and Austin where eviction filing rates largely remained at pre-pandemic levels. By September 2020, eviction filing rates largely leveled off with the CDC’s moratorium going into effect. Figure 1 shows eviction filings per week in Jacksonville, Florida, which typifies the general trend among cities, while figure 2 shows Austin’s consistent halt on evictions throughout the pandemic.
FIGURE 1 - Eviction Filings by Week for Jacksonville, Florida
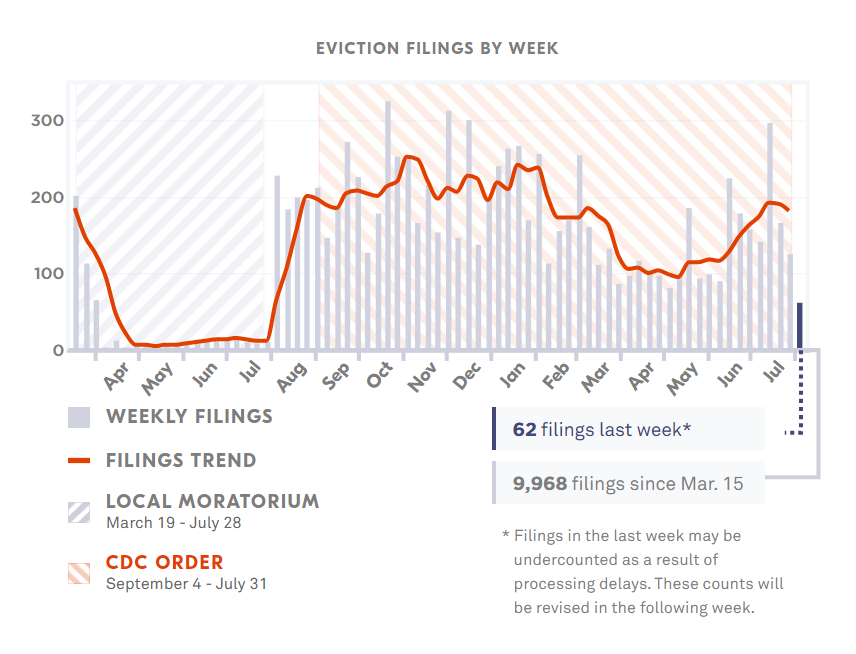
SOURCE: https://evictionlab.org/eviction-tracking/jacksonville-fl/
FIGURE 2 - Eviction Filings by Week for Austin, Texas
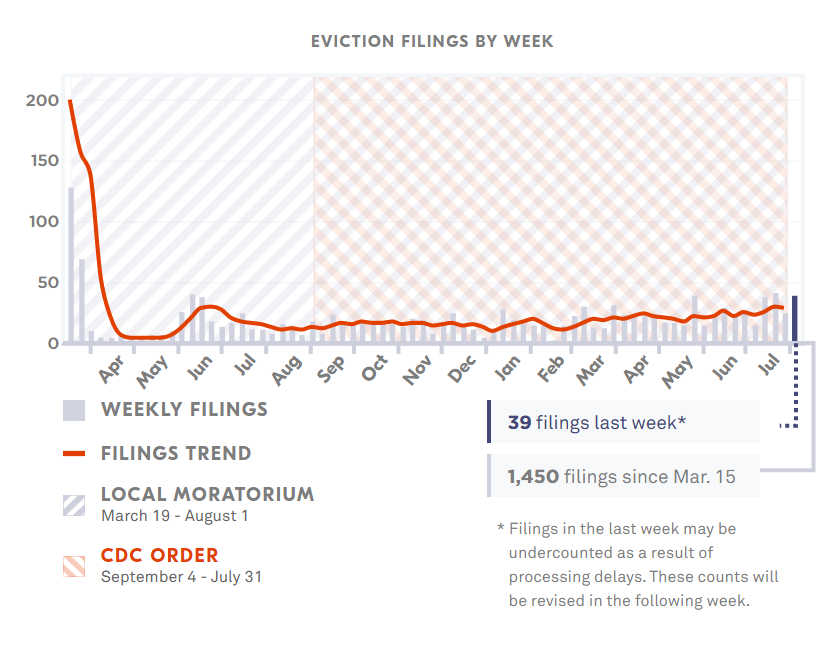
SOURCE: https://evictionlab.org/eviction-tracking/austin-tx/
Philadelphia’s Eviction Trends
Throughout the pandemic, Philadelphia has drastically reduced eviction filings, in large part because of the city’s eviction diversion program and the Emergency Housing Protection Act passed by City Council in July 2020. The diversion program requires landlords to apply for rental relief funds and enter dispute mediation with tenants before filing for eviction and has been viewed by some as a potential long-term solution for mitigating eviction rates. Yet the threat of eviction still looms for thousands of Philadelphians, with the eviction diversion program set to expire on August 31, 2021, and the federal moratorium already facing legal challenges. Philadelphia’s municipal courts have already approved over 2000 lockouts and eviction filing rates have been on a slow but steady rise since April 2021 (as seen in figure 3).
FIGURE 3 - Eviction Filings by Week for Philadelphia, Pennsylvania
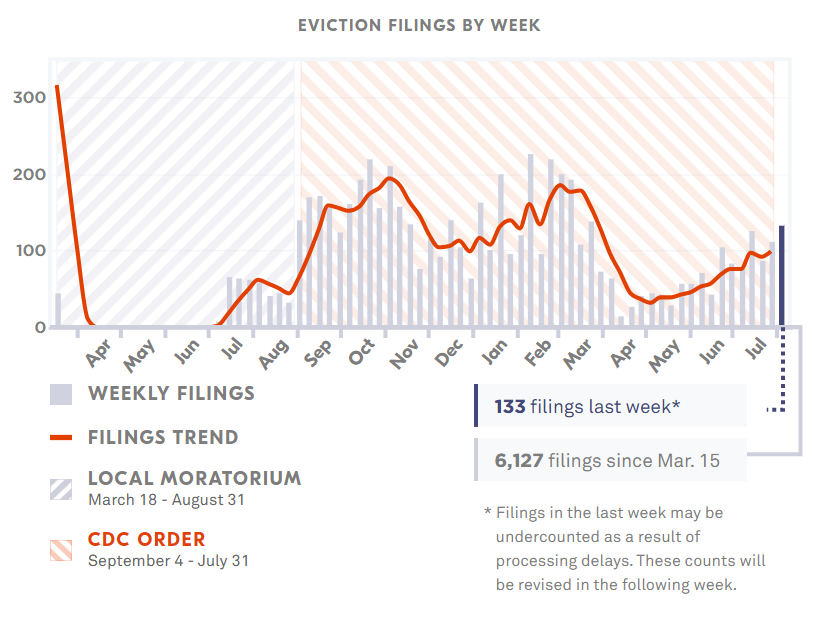
SOURCE: https://evictionlab.org/eviction-tracking/philadelphia-pa/
In addition to weekly coverage of eviction filings, the Eviction Lab features historic eviction filing data for most of the 31 cities, providing context for the current crisis and a means of evaluating Philadelphia’s success in its attempts to curb evictions. Historically, Philadelphia has had one of the nation’s highest concentrations of eviction filings. According to the Eviction Lab’s rankings of the top-evicting large US cities in 2016, Philadelphia ranked fourth with 10,264 total eviction filings, falling behind only New York City, Indianapolis, and Houston (see figure 4). Philadelphia’s eviction filing rate of 3.48 percent ranked eighty-first among large cities, but—along with San Antonio—was the only city with a population of over a million residents to make the top 100. During the pandemic, Philadelphia has performed significantly better with mortoriums significantly reducing eviction filings in the city.
FIGURE 4 - Rankings of Top Evicting Large U.S. Cities in 2016
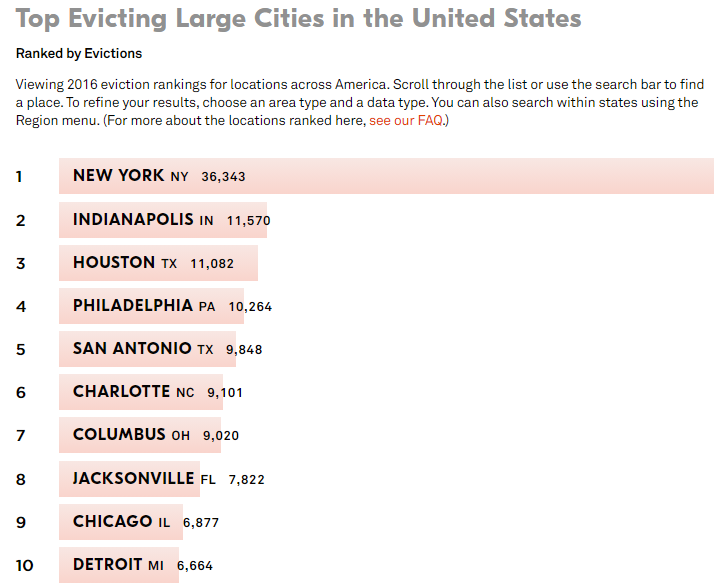
SOURCE: https://evictionlab.org/rankings/#/evictions?r=United%20States&a=0&d=evictions&lang=en
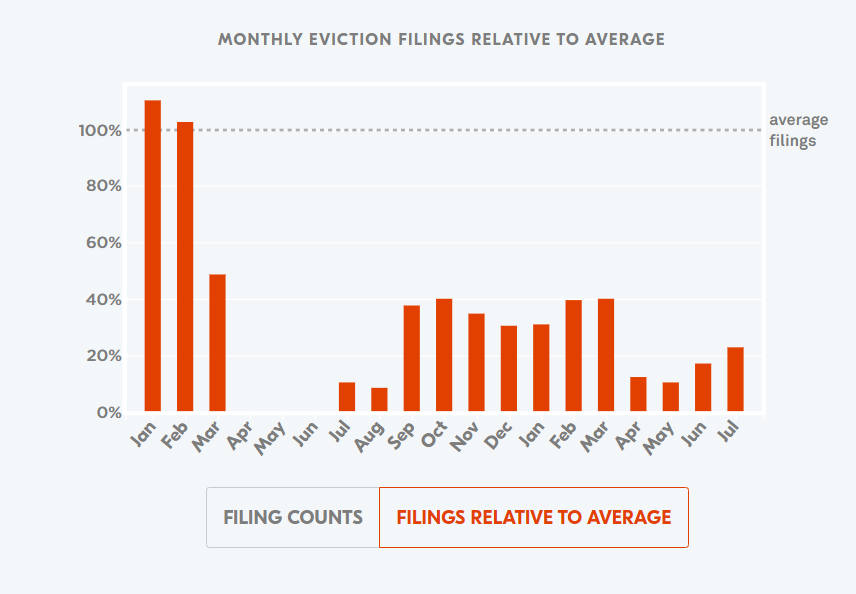
The eviction tracking system also features graphs of each city’s monthly eviction filings since January 2020 as a percentage of pre-pandemic averages, allowing for a more detailed assessment of the relative success of each city in curbing evictions. Figure 5 shows Philadelphia’s monthly eviction filings relative to the average number of filings from 2016 to 2019. Since April 2020, the number of eviction filings in Philadelphia remained below 40 percent of their 2016-2019 monthly averages. In fact, as of July 31, the city’s monthly eviction filings were 77 percent below average.
FIGURE 5 - Monthly Eviction Filings for Philadelphia from January 2020 to July 2021 with 2016-2019 Average Monthly Filings for Reference
SOURCE: https://evictionlab.org/eviction-tracking/philadelphia-pa/
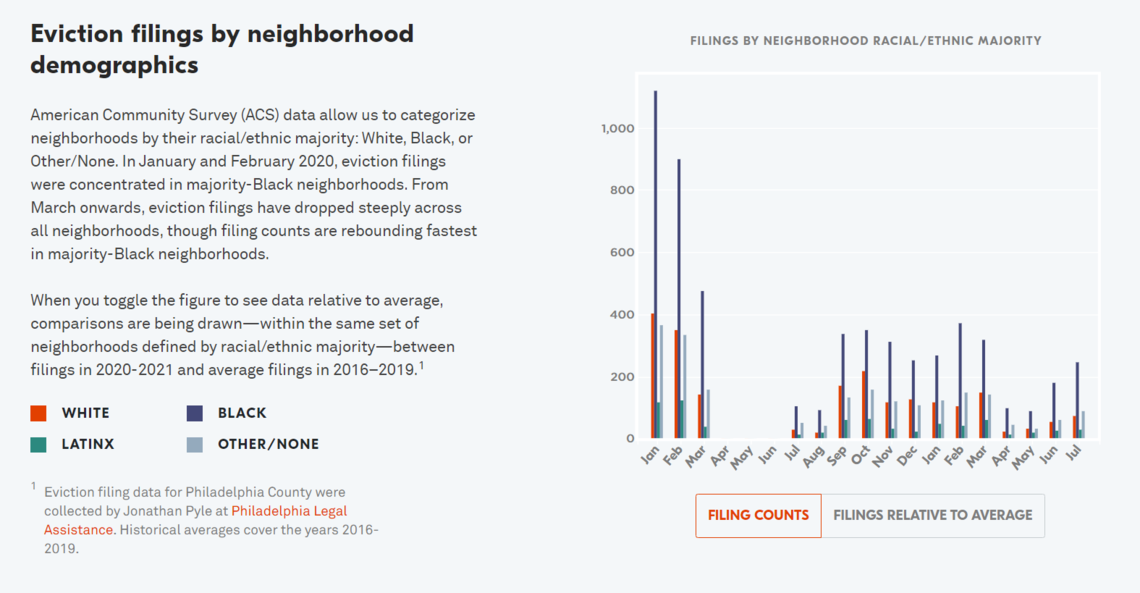
By combining eviction data with U.S. Census estimates, the eviction tracker also allows users to view the geographic and demographic distribution of eviction filings within cities. Complementing city-wide statistics, this feature helps understand which areas and communities are bearing the brunt of the eviction crisis. Figure 6 shows eviction filings by neighborhood demographics for Philadelphia, detailing the number of eviction filings per month broken down by the racial majority of each census tract. The chart highlights that Philadelphia’s majority Black neighborhoods saw both the highest number of eviction filings both prior to the pandemic as well as a rapid rebound as moratoriums subsided.
FIGURE 6 - Eviction Filings by Neighborhood Demographics in Philadelphia
SOURCE: https://evictionlab.org/eviction-tracking/philadelphia-pa/
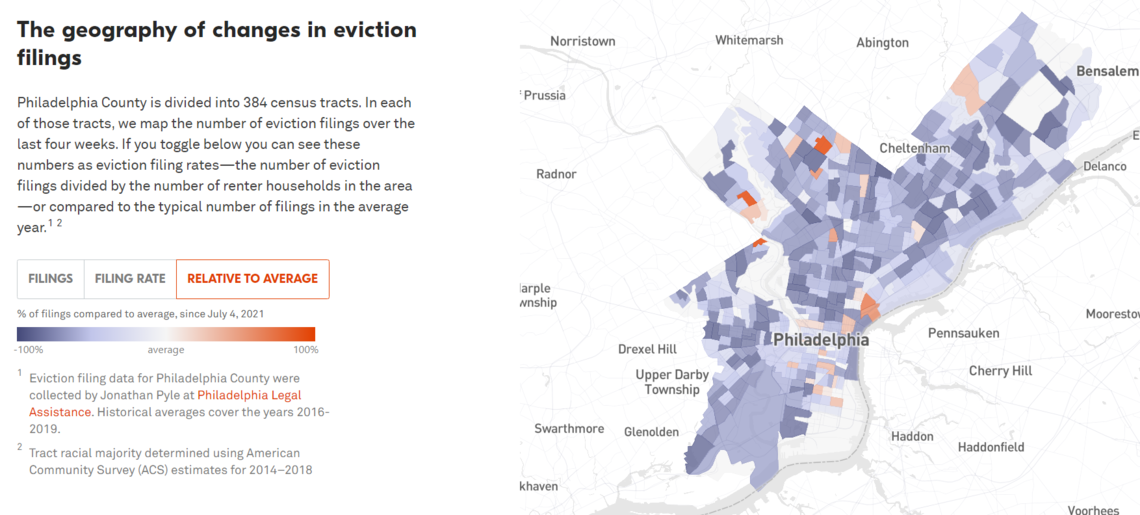
The final component of the report card for each city is a map of eviction filings by census tract, which allow the user to toggle between views of total filings, filing rate, and filings relative to the historic average (for Philadelphia: a 2016-2019 average). Figure 7 shows weekly filings compared to the 2016-2019 average for Philadelphia since July 4, 2021, color coding which areas fall above and below past averages for that census tract. As the map shows, most Philadelphia neighborhoods are still witnessing eviction filings far below average, with a few exceptions in South Philadelphia, Center City, and northwest portions of the city. Although this feature offers a helpful visualization of where eviction filings are concentrated, the tool’s use is limited by the narrow timeframe for the data represented. Mapping eviction filings on a bimonthly or quarterly rather than biweekly basis may provide a more robust view into the trends of eviction distribution – particularly during the pandemic.
FIGURE 7 - Geography of Changes in Eviction Filings for Philadelphia since July 4, 2021
SOURCE: https://evictionlab.org/eviction-tracking/philadelphia-pa/
Conclusion
With less than two months before the federal eviction moratorium expires, the need for new policies that will mitigate the looming housing crisis is more urgent than ever. The Eviction Lab has provided a powerful tool for policymakers working towards this end by making previously scattered eviction data available and easily digestible to the public. The Lab’s reports on the 31 cities highlight some clear lessons for Philadelphia and the nation at large.
- The federal policy isn’t doing enough. While evictions slowed after the federal moratorium was implemented, numbers have continued to fluctuate in Philadelphia and across other cities, with many approaching pre-pandemic levels.
- The eviction crisis is not being felt evenly by all communities. In Philadelphia, majority Black neighborhoods have seen eviction filing rates rebound much faster than other neighborhoods.
- Philadelphia’s robust local anti-eviction measures may have helped the city outperform its peer cities, moving significantly down the list of top evicting large cities since 2016.
Moving forward, we hope to see the Eviction Lab use insights from the data it has collected to explain policy successes at the local level. The Lab’s State Housing Policy Score Cards provide some understanding of the abilities of cities like Minneapolis, in high-scoring Minnesota, to halt evictions. It is less clear how Austin, the capital of low-scoring Texas, has fared so well.
The Eviction Lab’s methods leave room for improvement, particularly for cross-city comparisons, by standardizing the timeframe and geographies used for analysis. Using the same years and geographic units for data for all cities will allow for more accurate and nuanced comparisons.
Works Cited
“The Biden administration issues a new eviction moratorium as the virus surges” - The New York Times | August 3, 2021.
“Across American Cities, Evictions Are Down” - CityLab | August 18, 2020.
“How Philadelphia Plans to Beat the Looming Eviction Cliff” - CityLab | July 21, 2021.
Covid Data Tracker – Centers for Disease Control and Prevention | Accessed August
11, 2021.
“CDC: New Eviction Ban the ‘Right Thing to Do’ as Delta Variant Fuels Cases” - U.S. News and World Report | August 4, 2021.
“Federal judge skeptical new eviction moratorium can survive legal challenge” – NBC News | August 9, 2021.
“Pa. Supreme Court extends Philly's eviction diversion program, requiring landlord-tenant mediation” - PhillyVoice | July 1, 2021.