Philadelphia’s Looming Housing Affordability Crisis – Part 4
In the final piece of our housing affordability series of 2021, we detail home values and rent burden within and across Philadelphia’s neighborhoods.
Key Takeaways
- Areas in proximity to the city’s colleges, universities, specialized schools, and hospitals fared worst on housing affordability metrics for 2019.
- A West Philadelphia tract closest to the University of Pennsylvania showed the highest price-to-income ratio at 26.2 – indicating that it would take more than 26 years of the median household’s income to afford a home at the median value.
- At 86 percent, North Philadelphia’s Bustleton neighborhood contained the highest proportion of rent-burdened households in 2019.
- The greatest price-to-income ratio increases from 2009 to 2019 were in Philadelphia’s University Southwest and Lower North neighborhood districts, at 17 and 13 times that of the city’s average increase during the same period.
- The outlying neighborhood districts within Northeast Philadelphia, Southwest Philadelphia, and the Upper Northwest district all saw increases in their average concentration of rent burdened residents from 2009 to 2019.
A Neighborhood Overview
Philadelphia is a city of neighborhoods. There are many unique areas of the city full of diverse communities and history. Yet, where one lives can determine access to social and financial resources – like food and nutrition, adequate schooling, and safe and affordable housing [1]. Figure 1 illustrates the price-to-income ratio and rent burdened population of census tracts within Philadelphia’s neighborhood districts.
FIGURE 1
SOURCE: Data were obtained from five-year estimates of the U.S. Census Bureau’s 2019 American Community Survey.
As previously discussed, the home-price-to-income ratio is the projected number of years of income it would take to afford a home; the standard price-to-income ratio utilized by the real estate industry for mortgage qualification is 2.6 years. Rent burden is a benchmark measure of rent affordability; a household is considered rent-burdened if it spends more than 30 percent of income.
Figure 1 demonstrates that census tracts in proximity to the city’s colleges, universities, specialized schools, and hospitals featured high price-to-income ratios in 2019. In fact, one West Philadelphia tract closest to the University of Pennsylvania had the highest price-to-income ratio of 26.2 in 2019 – meaning it would take more than 26 years of the median household’s income to afford a home at the median value. Many of the city’s anchor institutions are located within predominantly low-income neighborhoods composed of both low-wage households of color and student populations with little to no income. Other tracts with high price-to-income ratios include wealthier neighborhoods like Rittenhouse Square and sections of East and West Center City surrounding Market Street. The high unaffordability of these areas reflects their highly competitive real estate markets that cater to both international businesses as well as high-end luxury homes.
Rent-burden also seems prevalent in proximity to the city’s anchor institutions but can also be found in low-income areas of North Philadelphia, the Northeast, far West Philadelphia, and Southwest Philadelphia. North Philadelphia’s Bustleton neighborhood contains the highest proportion of rent-burdened households in 2019 at 86 percent. While some areas have both high home values and rents, rent burden seems to be more widely dispersed in Philadelphia.
Changing Neighborhood Price-to-Income Ratios
Using consecutive five-year estimates from the U.S. Census Bureau’s American Community Survey (since annual estimates are not available for census tracts) and the City of Philadelphia’s neighborhood planning districts as proxy neighborhoods, Figure 2A illustrates the average change in each neighborhood districts’ home-price-to-income ratio from 2009 to 2019, while figure 2B tabulates the differences.
FIGURE 2A
SOURCE: Data were obtained from five-year estimates of the U.S. Census Bureau’s 2009, 2014, and 2019 American Community Surveys.
FIGURE 2B
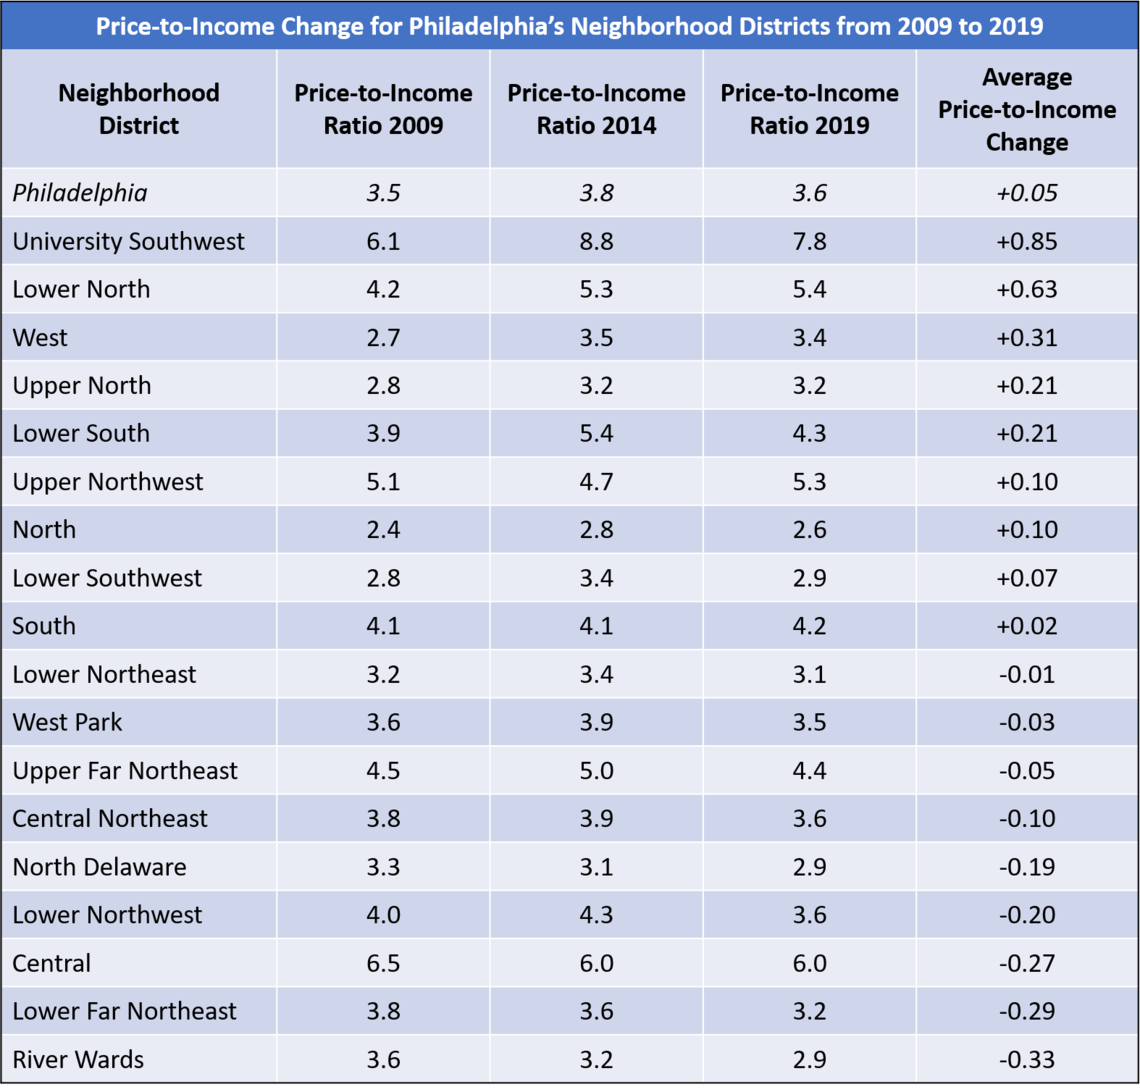
SOURCE: Data were obtained from five-year estimates of the U.S. Census Bureau’s 2009, 2014, and 2019 American Community Surveys.
As of 2019, the home-price-to-income ratio for Philadelphia stood at 3.6, an average increase of 0.05 during the consecutive five-year periods from 2009 to 2019. Just under half of the city’s neighborhood districts saw above average increases in their price-to-income ratios during the same period. The two largest average increases occurred in the University Southwest and Lower North neighborhood districts, at 17 and 13 times that of the city’s average increase. These districts are home to major anchors institutions, like the University of Pennsylvania and Temple University, and contain neighborhoods linked to gentrification in the past decade, such as Breweytown, Olde Kensington, and Norris Square in the Lower North and Spruce Hill, Powelton Village, and Walnut Hill in University Southwest.
The most significant average decreases in home-price-to-income from 2009 to 2019 occurred in the wealthy Central district as well as the traditionally white low- to middle-income River Wards, Lower Far Northeast, Lower Northwest, and North Delaware districts. While some neighborhoods in these districts are also considered to be gentrifying (or have gentrified), such as Fishtown, Northern Liberties, Graduate Hospital, and Manayunk, these outer districts are also home to traditional white working- to middle-class enclaves that have seen recent influxes of lower-income populations looking for more affordable housing – specifically the far Northeast and Roxborough [2,3].
The Change in Rent Burden
Figure 3A illustrates the change in the concentration of rent burdened households for each neighborhood district from 2009 to 2019 while figure 3B provides the raw data. As of 2019, approximately 50 percent of the city’s residents were spending 30 percent or more of their incomes to pay rent. The rent-burdened population declined slightly between 2009 and 2019, an average of 0.3 percent over the consecutive five-year periods. The outlying neighborhood districts of Northeast Philadelphia, Southwest Philadelphia, and the Upper Northwest district all saw above average increases in their concentration of rent burdened residents. This may reflect a push of low-income populations away from inner neighborhoods with previously affordable rent.
FIGURE 3A
SOURCE: Data were obtained from five-year estimates of the U.S. Census Bureau’s 2009, 2014, and 2019 American Community Surveys.
FIGURE 3B
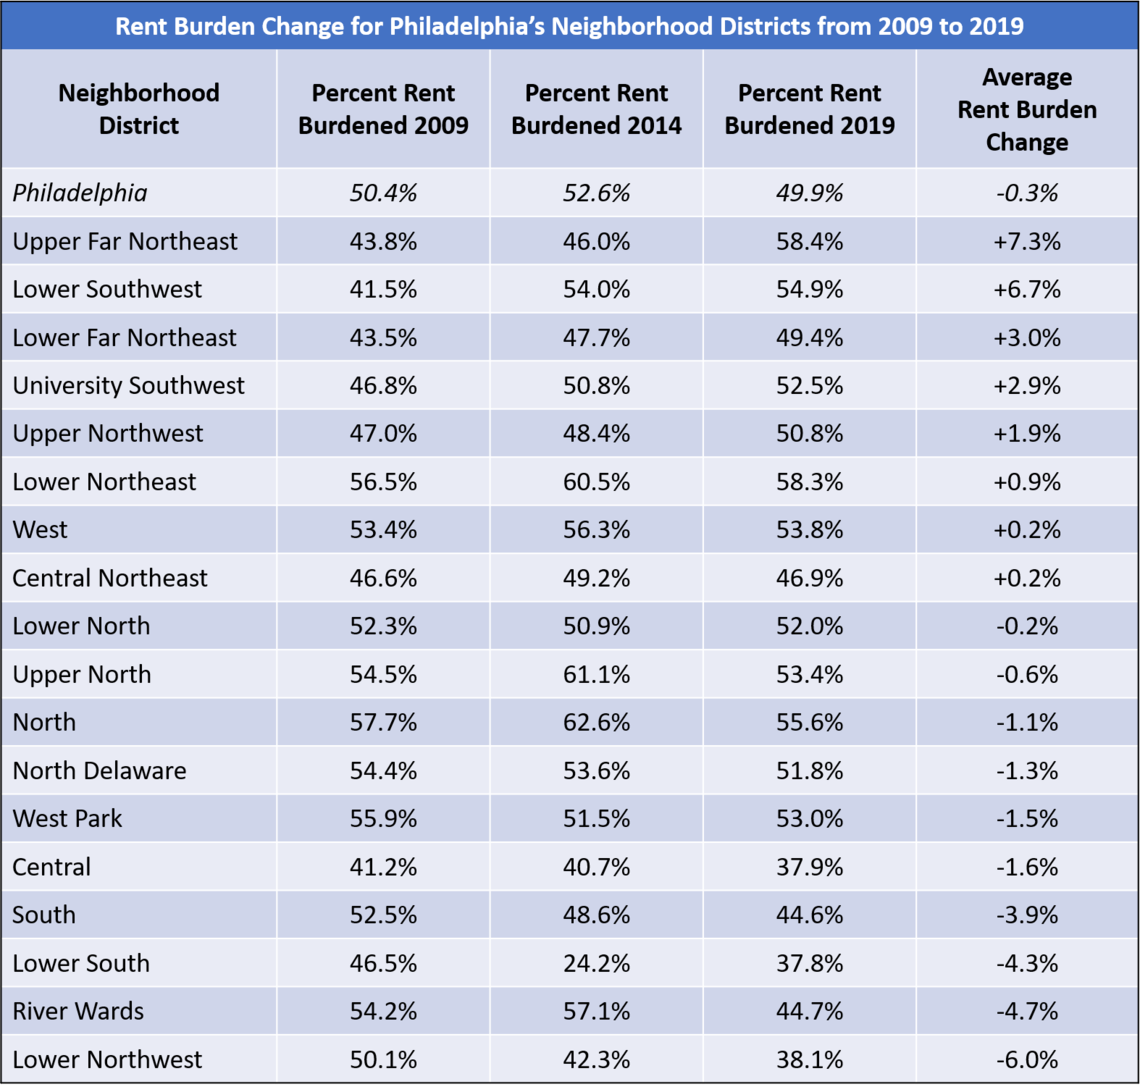
SOURCE: Data were obtained from five-year estimates of the U.S. Census Bureau’s 2009, 2014, and 2019 American Community Surveys.
The largest decreases in the average concentration of rent burdened residents were found in the Lower Northwest, River Wards, Lower South, and South neighborhood districts. The decreases in rent burden coincide with the decreases in the price-to-income ratios for the Lower Northwest and River Wards districts. As noted, these districts include neighborhoods generally linked to gentrification in the past decade, which may contribute to the decrease in rent burden. This also holds true for the South and Lower South districts, although both saw increases in their price-to-income ratios over the same time period. With more middle- and upper-income white residents pushing to live closer to the city’s job centers, it is possible that lower-income residents are being displaced into outlying neighborhoods where the rent burden is increasing. More research on this hypothesis is needed.
Housing Affordability and Employment Opportunities in Philadelphia
Over this four-piece series, we have viewed Philadelphia’s looming housing affordability crisis from multiple angles. Philadelphia is often touted as an affordable city in comparison with many of its peer cities across the U.S. [4], yet findings from this series show that that affordability may be on the decline for much of the population. In part, this may be a jobs-and-income problem, an artifact of Philadelphia’s stagnant wage growth coupled with minimal increases in steady career-building employment opportunities. If current trends continue, Philadelphia’s housing market may soon reflect levels of inequality seen in New York City, San Francisco, Washington D.C, and Boston. Policies are needed that both create more affordable housing and more quality jobs if we are to avoid this outcome.
Works Cited
[1] Ramakrishnan, Kriti, Elizabeth Champion, Megan Gallagher, & Keith Fudge. 2021. Research Report: Why Housing Matters for Upward Mobility: Evidence and Indicators for Practitioners and Policymakers. Washington D.C: The Urban Institute. Retrieved from: (https://www.urban.org/research/publication/why-housing-matters-upward-mobility-evidence-and-indicators-practitioners-and-policymakers/view/full_report).
[2] Lubrano, Alfred. 2019. “Why is poverty increasing in Northeast Philly? Aging population, immigration, gentrification.” The Philadelphia Inquirer, 19 September. Retrieved from: (https://www.inquirer.com/news/poverty-northeast-philadelphia-aging-gentrification-immigration-20190919.html).
[3] Blumgart, Jake. 2018. “Want to move to a better neighborhood? In Philly, help is on the way.” PlanPhilly, 28 April. Retrieved from: (https://whyy.org/articles/want-to-move-to-a-better-neighborhood-in-philly-help-is-on-the-way/).
[4] Leighton, Kelly. 2019. “Philadelphia named one of the most affordable cities in the country.” Pennsylvania Association of Realtors, January 18. Retrieved from: (https://www.parealtors.org/philadelphia-named-one-of-the-most-affordable-cities-in-the-country/).