MasterCard's Inclusive Growth Score
The Greater Philadelphia Metropolitan Region is rich in data. Numerous public and private organizations and agencies collect and share various forms of data that “data-translating” organizations—like the Economy League—use to analyze metrics of inclusive growth, equitable opportunities, and shared prosperity. As “meaning-makers and wayfinders” we are always on the hunt for new data resources especially as we build out our PolicyHub data repository. In this week’s Leading Indicator, we highlight the Inclusive Growth Score tool from MasterCard’s Center for Inclusive Growth – a new and exciting tool that compiles metrics of business development that are sorely lacking in other publicly available data.
MasterCard created the Inclusive Growth Score (IGS) metric to help identify where a community’s economic potential is being stifled or unleashed. Given that inclusive growth is essential for addressing income and wealth gaps produced by structural racism, the IGS serves as an important measure for visualizing systemic disadvantages and formulating targeted economic development strategies. Launched in Autumn 2019, the IGS provides an index built on the pillars of Place, Economy, and Community, representing key wealth building components of local communities – housing, infrastructure, business growth, job growth, and financial inclusion. Underlying each pillar are six socioeconomic metrics that come from various public and private data sources. For example, the Economy pillar comprises measures of New Business Growth, Individual Spending Growth, Small Business Loans per year, Minority/Women Owned Businesses, a Labor Market Engagement Index, and Commercial Diversity. While many of these metrics come from publicly available data sources, like the U.S. Census Bureau’s American Community Survey and The Trust for Public Land, MasterCard has leveraged its own payment data to round out business and spending trends; these added data points provide a richer picture of economic activity within lower-level geographies often missing from U.S. Census and other publicly available data. Thus, the IGS is a unique tool that can shed some light on the state of inclusive growth and shared prosperity in Philadelphia and other major cities.
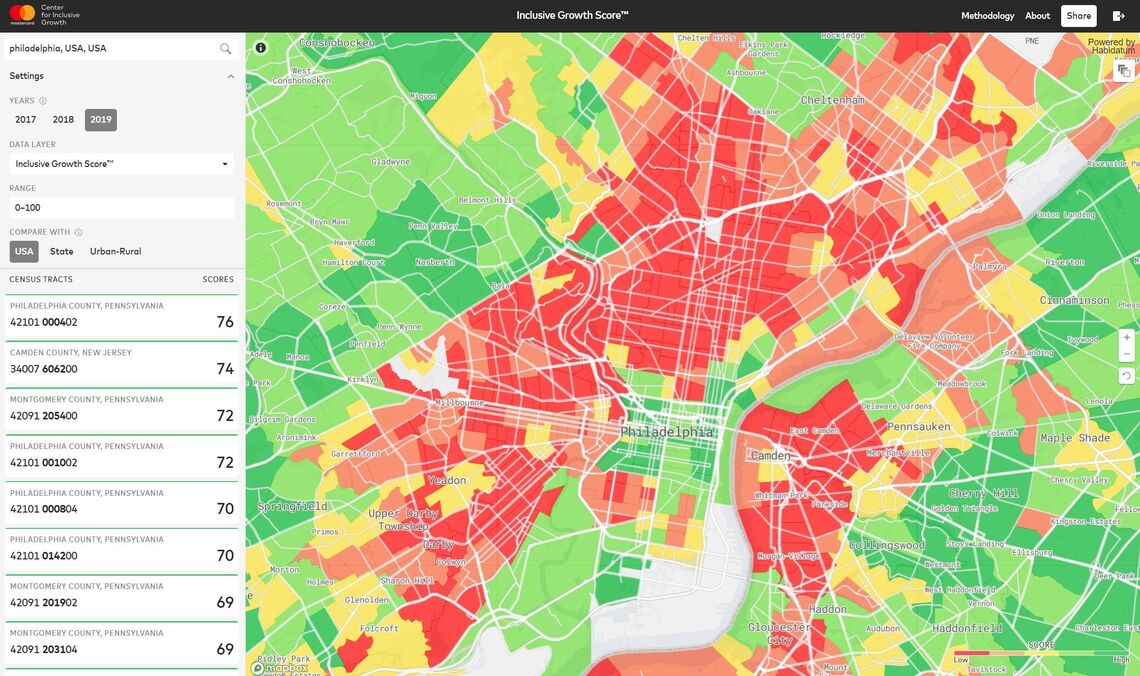
For Philadelphia, the IGS lends nuance to some of the existing dynamics of inequality and privilege well known to policymakers, journalists, researchers, and community leaders. Figure 1 shows the distribution of the IGS across Philadelphia’s census tracts. Overall census tracts around Center City, Chestnut Hill, Roxborough/Manayunk, and Queen Village/Bella Vista show higher scores than tracts in North Philadelphia, West and Southwest Philadelphia, Northeast Philadelphia, Grays Ferry, and West Passyunk. Higher-scored tracts have both a large concentration of businesses and wealthier, majority-white residential populations. The highest IGS for Philadelphia in 2019 was 76, ascribed to a Center City tract directly west of City Hall and bordered by Arch Street in the north, Broad Street in the east, Chestnut Street in the south, and 20th Street in the west.
FIGURE 1
Yet by disaggregating components of the IGS, we can question some ‘common knowledge’ about sections of Philadelphia that have generally been viewed as bereft of economic activity. For example, Figure 2 highlights the New Business growth metric of the Economy pillar in North Philadelphia. It reveals that a number of neighborhoods such as Franklinville, Feltonville, Juniata, Port Richmond, Harrowgate, Kensington, Allegheny West, Brewerytown, and Cecil B. Moore score higher than average for new business growth. In fact, the area around Feltownville and Juniata scored three times higher in new business growth than the average census tract score in the U.S. It is also interesting to note how some of these metrics, like the new business growth measures, correlate with colloquial gentrification patterns, such as new business activity in Brewerytown, East Kensington, and Mount Airy.
FIGURE 2
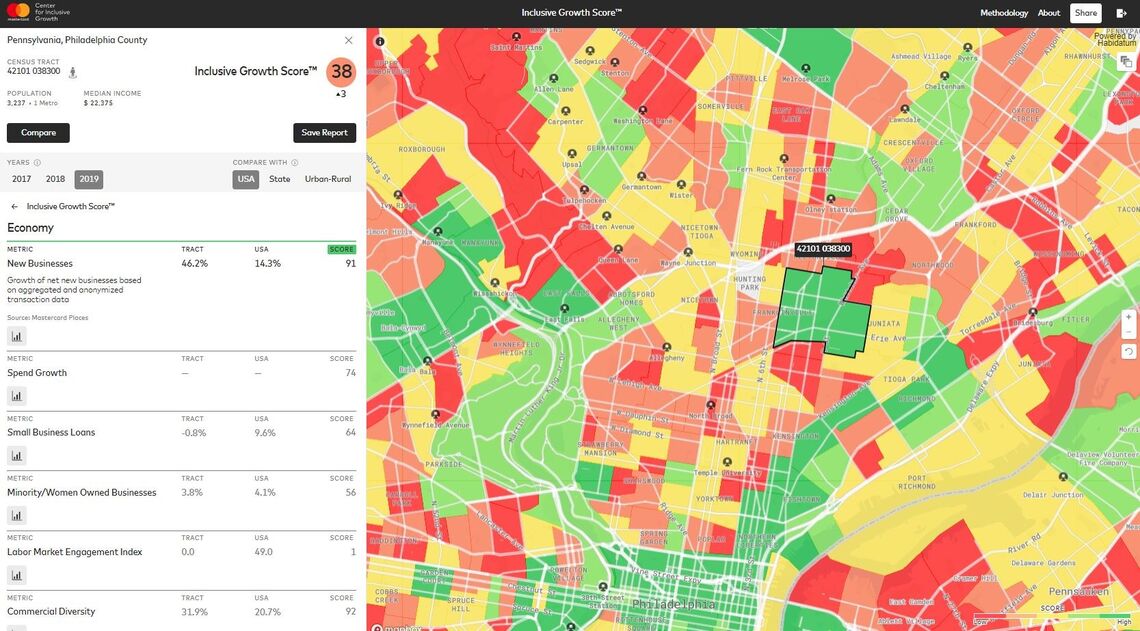
NOTE: Figure 2 zooms in on North Philadelphia - with Center City directly at the bottom of the image. The tract encompassing Fetonville and sections of Juniata is highlighted, and its individual Economy metrics are displayed in the left panel.
Figure 3 illustrates the proportion of total businesses within a census tract that are owned by a person of color or a woman; a useful metric for measuring financial inclusion and shared prosperity across municipalities. Publicly available, fine-grained, and localized data about businesses owned by people of color is hard to find, so the MasterCard initiative is quite valuable. The data reveal some bright spots: for example, the highest concentrations of businesses owned by women and people of color are in parts of West Kensington, Glenwood, Fairhill, Nicetown-Tioga, and Germantown, far outstripping wealthier and whiter sections of Center City. In fact, Nicetown-Tioga scored a 94 for minority- and women-owned businesses in 2019, while Rittenhouse Square and Society Hill scored 17 and 29, respectively. Data like these can inform policy decisions, such as where to target investment in commercial corridors.
FIGURE 3
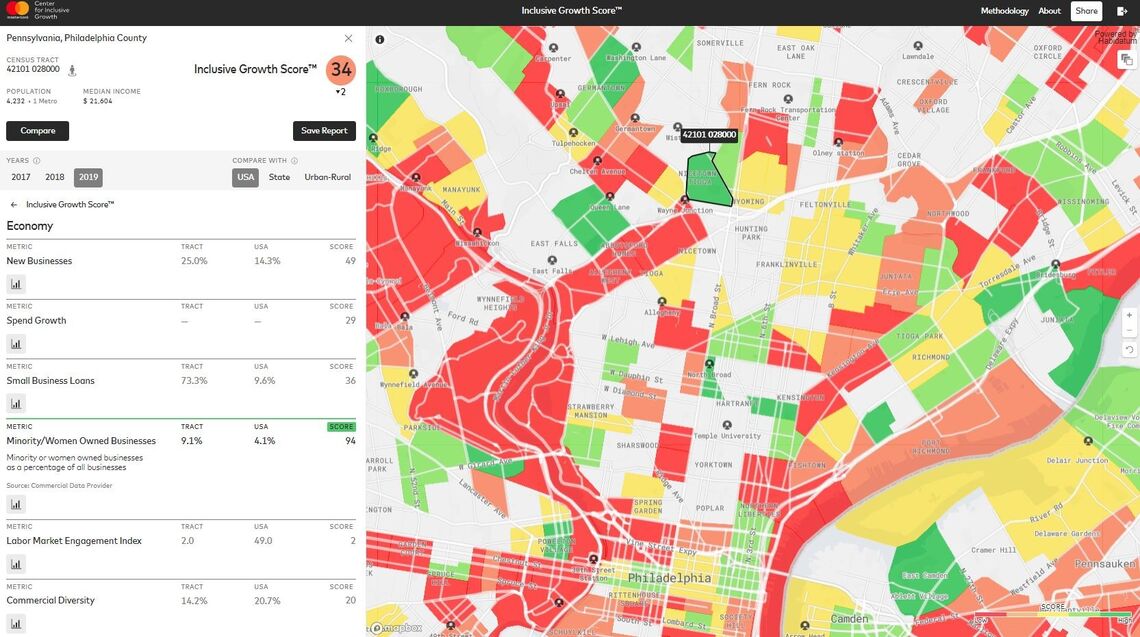
NOTE: Figure 3 zooms in on North Philadelphia - with Center City directly at the bottom of the image. The tract encompassing Nicetown-Tioga is highlighted, and its individual Economy metrics are displayed in the left panel.
Metrics of inclusive growth and shared economic prosperity will be vital assets for further understanding both the need for and impact of ongoing economic development initiatives. In addition to our work with PolicyHub, the Economy League looks forward to digging deeper with these data to identify areas in need of more targeted workforce development practices, more business investment from local anchor institutions, and new innovative ideas to address continuing disparities.