Hard stats from this year’s World Class Summit that need attention now
July 20, 2015
Mo Manklang, Generocity
The summit featured stats on regional economy and inequality
This year’s World Class Summit was packed with information. Hundreds of people filled the room at the Convention Center, to see how we’re shaping up according to the World Class Index, the tracking framework that was released last year.
Those stats ranged from incrementally better to startlingly negative. This year’s theme, “Expanding Opportunity”, is indicative of what we now need to do–expand the slow growth that we’re seeing, if we truly want Philly to become a city of social enterprise and innovation.
"Regional growth strategies are not good enough” said Amy Liu, this year’s keynote. “We need to build an economy that works for all.”
Liu’s speech launched the night with examples of work in other cities that should be looked at, like Chicago’s i.c. stars |* that identifys, trains, and jump-starts technology careers for low-income young adults, the Toyota advanced manufacturing apprenticeship in Lexington that combines coursework on fabrication, electricity, and related topics with practical work experience on the plant floor. These programs look to grow the next generation of accountable leaders to grow their local economies.
Liu also talked about having a “no community left behind” attitude, citing programs like Montgomery County, Maryland’s Neighborhood Opportunity Network, which provides help applying for assistance with utility bills, rent, food, healthcare, and foreclosure prevention.
Steve Wray and Josh Sevin then took over the reins to take things local for Philly, highlighting hard-to-swallow numbers about our growth:
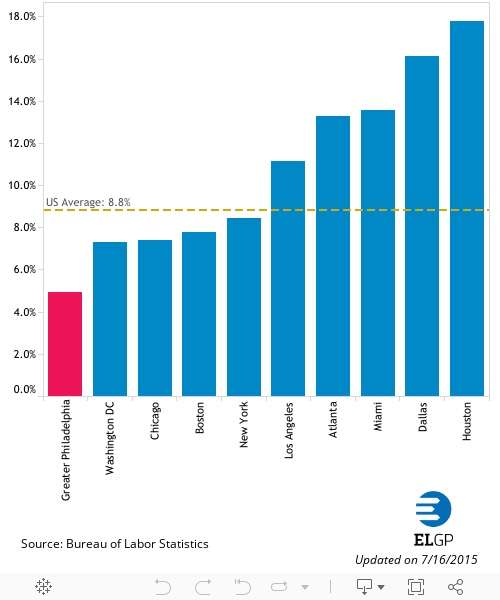
Job growth is better, but very slow.
The number of jobs in the region grew 4.9 percent between 2010 and 2015, but we’re still dead last among the ten largest metro areas in the U.S.
EMPLOYMENT GROWTH, BY METRO AREA (FEB. 2010 - FEB. 2015)
Philly has a huge percentage of unemployed…
22.3 percent of noninstitutionalized civilians ages 18-64 are employed or seeking employment. While that’s more than the national average, we still lag behind other top metros including Washington, Boston, Chicago, Dallas, Miami and Atlanta.
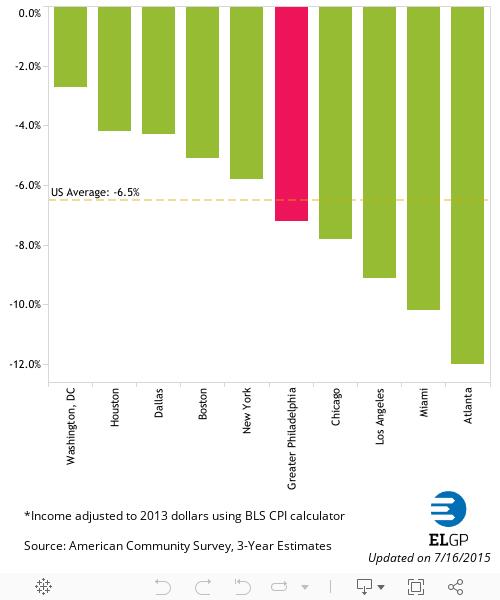
…And those who are working are making less.
The median household income in Greater Philadelphia has declined by $4,700 since 2009. The average household in Greater Philadelphia earns around $61,000 annually, which ranks us 4th among our peers.
PERCENT CHANGE IN REAL MEDIAN HOUSEHOLD INCOME BY METRO AREA, 2013 DOLLARS (2009-2013)*
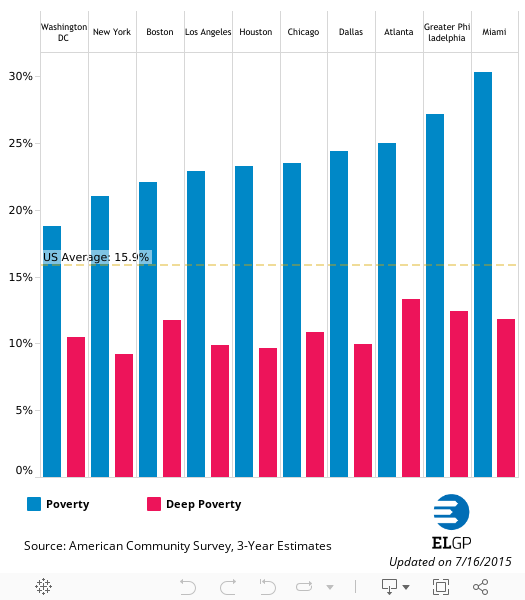
The poverty rate is staggering.
Philadelphia continues to be near the head of the pack in poverty, with the second-highest share of people living in poverty and in deep poverty (defined as 50 percent of the federal poverty level).
PERCENTAGE OF PEOPLE LIVING IN POVERTY AND DEEP POVERTY, BY CORE CITY IN 10 LARGEST METRO AREAS (2013)
Our youth are not engaged at school or work at an alarming rate.
In Greater Philadelphia, more than 106,000 youth ages 16-24 are considered “disconnected,” meaning they are not enrolled in school and are not working. Greater Philadelphia was the only region out of the 10 largest to experience an increase in disconnected youth between 2010 and 2014.
So altogether, what does this mean?
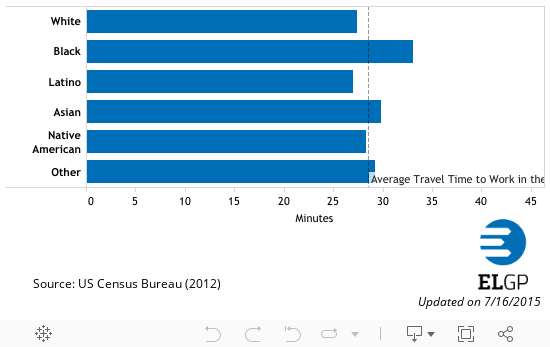
This all adds up to a hugely unequal regional economy. One telling breakdown showed that black people generally have a longer average travel time to work, based on census data.
AVERAGE TRAVEL TIME TO WORK IN GREATER PHILADELPHIA, BY RACE (2012)
A recent study of 184 US metro areas with a population of at least 250,000 found that a region’s ability to sustain growth over time is positively associated with measures of equity, including lower income inequality.
According to the Economy League of Greater Philadelphia, the key is opportunity: expanding broad access to opportunity in our region will help lift more people out of poverty.
You can read the Economy League’s full writeup of this year’s findings here, and the particularly data-driven folk can find some deeper dives here.