Philadelphia's Innovation Economy in Seven Charts
July 14, 2014
Juliana Reyes, Technical.ly Philly
Is there more innovation action in the Philadelphia region than there was five years ago?
That’s one question the Economy League‘s recently released World Class Index seeks to answer. The Index, full of statistics and graphs, aims to track the region’s progress in business growth, but also infrastructure and education. It’s part of the organization’s new mission: to move from straight research to pushing a set of shared goals for the region.
Some of the innovation-relevant stats in the Index show growth over the last five years, including:
-
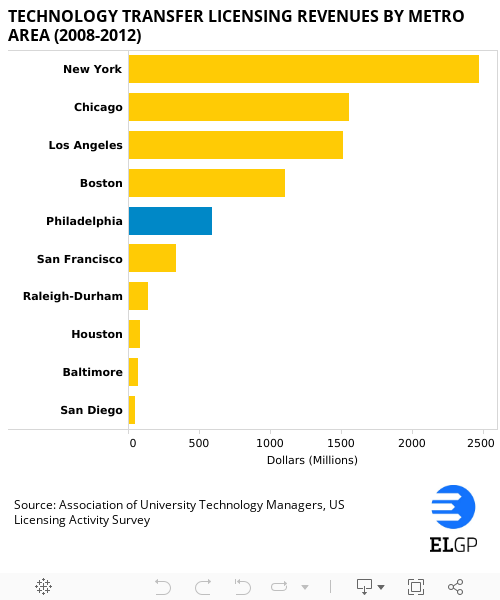
Tech Transfer: The number of licensing agreements in Greater Philadelphia roughly doubled — from 83 in 2008 to 161 in 2012, the highest growth rate among top R&D regions. “Similar growth has occurred over the same period at area research institutions for invention disclosures (from 682 to 860), patents awarded (from 78 to 167), and spinout companies formed (from 6 to 25),” the Index reported. The area’s academic and medical research institutions are an increasingly dominant force.
-
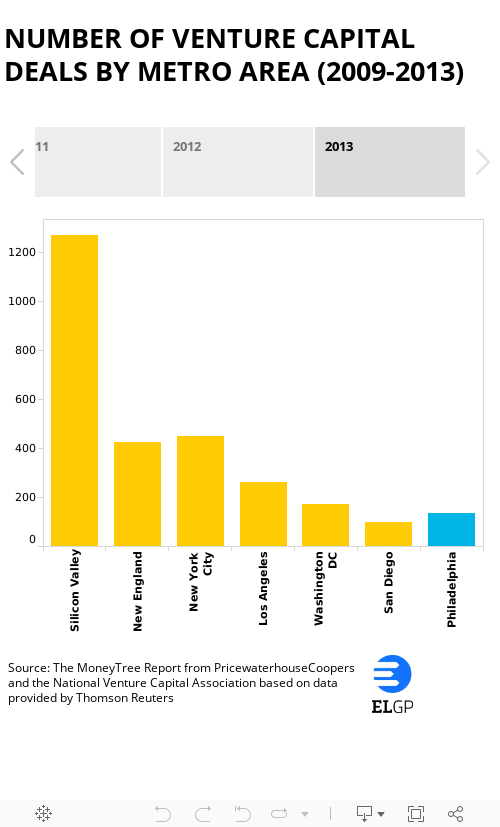
Venture Capital: “In 2013, 136 investment deals were closed in the region — a 42% increase over the 2009 total,” the Index reported. What’s more: “Industries in the life sciences sector received nearly 60% of all venture capital investment last year,” reinforcing the point about the region’s flourishing tech transfer scene, where medical schools are responsible for the bulk of university spinout startups. In other respects, however, the VC picture is far less rosy. More on that in a bit.
In other fields, the region has stayed consistent:
-
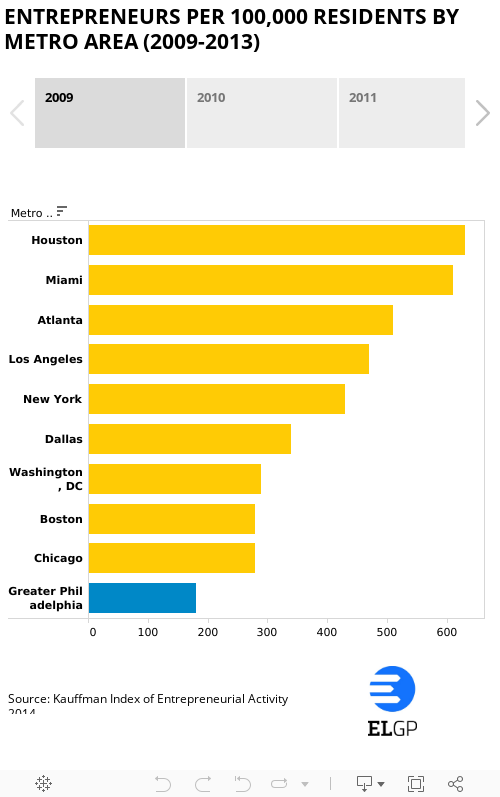
Entrepreneurship: “Between 2009 and 2013, our region saw no net change in the number of entrepreneurs per 100,000 residents,” while every other major metro area, except Los Angeles, lost entrepreneurs.
-
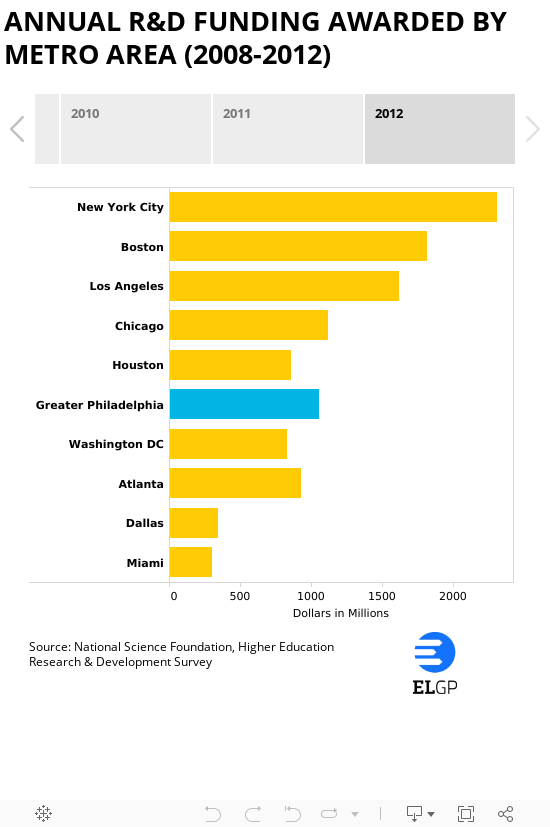
Federal R&D Funding: The region has consistently received the fifth-largest amount of federal R&D funding each year between 2009 and 2012. In 2008, it dropped to sixth place.
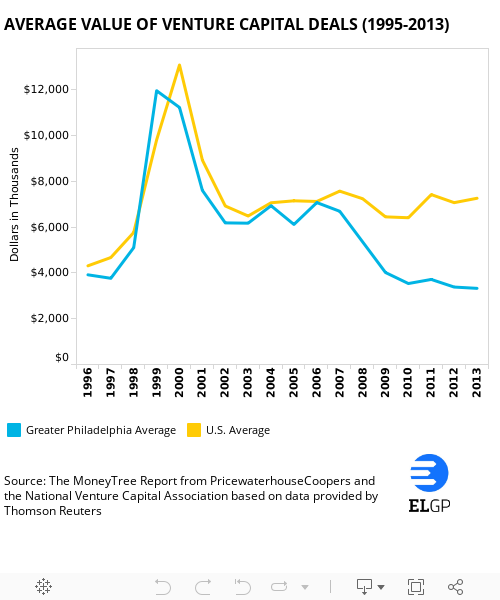
The one area where the region lags is the size of venture capital deals.
“Since the onset of the Great Recession in 2008, Greater Philadelphia’s average deal value has dropped significantly. By 2013, our region’s average value decreased to $3.3 million, less than half of the national average of $7.2 million,”according to the Index.
Check out the data in the interactive charts below.


Read more at Technical.ly Philly >>