Regional Employment Growth Amidst the Pandemic
The current number of new job posts in the U.S. is roughly 14 percent lower than this time last year, according to a recent data brief released by the FRED Research Division of the Federal Reserve Bank of St. Louis. With employment continuing to crawl back to pre-pandemic levels and the City of Philadelphia’s recent reinstatement of social gathering restrictions, in this Leading Indicator we are taking a closer look at regional employment growth during the pandemic; specifically, which industries grew or quickly rebounded in the midst of the pandemic.
Key Takeaways
- From May to October 2020, Indeed job posts in Greater Philadelphia increased an average 3.9 percent a month - 1.5 percent less than the average monthly growth of national Indeed job posts.
- Total employment in Greater Philadelphia grew on average by 2.1 percent per month between April and August 2020.
- Federal government employment in the region saw consistent growth from January to August 2020 (by 1.29 percent), driven largely by the hiring of temporary 2020 Census workers.
- The Leisure and Hospitality, Mining, Logging, and Construction, and Other Services industries experienced significant average monthly growth from April to August 2020, at 14.9, 9.4, and 8.1 percent respectively; however, this growth is largely reflective of the deep employment declines these industries experienced at the onset of the pandemic.
- At 3.1 and 2.3 percent, respectively, the Retail Trade and Health Care & Social Assistance industry sectors both surpassed the region’s average monthly employment growth from April to August 2020 and showed higher than average job posts rates in the City of Philadelphia.
Unemployment and New Job Posts during the Pandemic
Employment plummeted during the initial months of the COVID-19 pandemic as many states and municipalities instituted social gathering restrictions in the name of public health and safety. Meant to slow the number of persons contracting the novel coronavirus, the restrictions amounted to an economic lockdown since most workers deemed “nonessential” were ordered to work from home. The work-from-home regime had a devastating ripple effect on businesses that serve many nonessential workers—such as restaurants, retail businesses, transportation services, and hotels. These businesses were forced to furlough or layoff their employees as customers and revenue streams significantly diminished.
Further, depressed demand forced many businesses and companies—previously looking to hire—to halt or cancel job searches. The combination of this hiring freeze with layoffs and furloughs significantly and rapidly expanded unemployment numbers across the country. Figure 1 depicts the growth of the unemployed populations in the U.S. and Greater Philadelphia and the decrease in job posts using recently released job posting data from Indeed curated by FRED.
FIGURE 1
NOTE: Data obtained from the FRED Research Division of the Federal Reserve Bank of St. Louis and the Bureau of Labor Statistics.
Figure 1 illustrates the lack of churn in the labor force during the initial months of the pandemic. In a strong economy, like that which immediately preceded the pandemic, the recently unemployed have a greater chance of finding a new job. Churn is natural in a capitalist job market; there are always individuals who become unemployed for a short period of time but are then able to return to the labor force. In times of severe economic downturn, however, there are fewer opportunities for employment or new business investment, so the unemployment count continues to rise. This trend only subsides when new employment opportunities begin to trickle back into the job market – often the result of government stimulus programs and investments that drive capital and opportunity back into the private market. Figure 1 shows that new job posts began to increase in both the U.S. and Greater Philadelphia from May to October 2020. In fact, Indeed job posts in the U.S. saw an average monthly increase of 5.4 percent from May to October 2020 while posts in Greater Philadelphia saw an average monthly increase of 3.9 percent. As these new job posts have increased, the unemployment rates in both the U.S. and Philadelphia have continued to decline.
Figure 1 also shows the trajectory of growth for high-wage and low-wage job posts at the national level. With an average increase of 5.3 percent per month between May and October 2020, low-wage job posts significantly outpaced high-wage job posts by 1.7 percent across the country. In fact, low-wage job posts in October 2020 were only 9.7 percent lower than low-wage job postings in October 2019; high-wage job posts, on the other hand, were almost 20 percent lower than the previous year.
The rapid rebound of low-wage job postings relative to high-wage postings could have significant implications for the post-pandemic economic recovery. If these recent job posts represent the return of jobs previously furloughed or temporarily eliminated in March and April 2020, then it indicates that recovery from the COVID-induced economic downturn will continue to be slow and subject to potential relapse this winter. On the other hand, if these increases represent newly created jobs, the labor market is skewing toward a higher proportion of low-wage, foundational-skill-level employment – a shaky foundation of employment that will be less resilient to the next recession.
Greater Philadelphia’s Employment Growth and Bounce-Back
The data on growth in job postings allows us to identify which local industries have grown their employment bases since the onset of the pandemic. Figure 2 details the average monthly growth rates of major industries within Greater Philadelphia during significant portions of the pandemic while figure 3 provides a visual representation of each industry’s employment growth indexed from January 2020 employment levels.
FIGURE 2
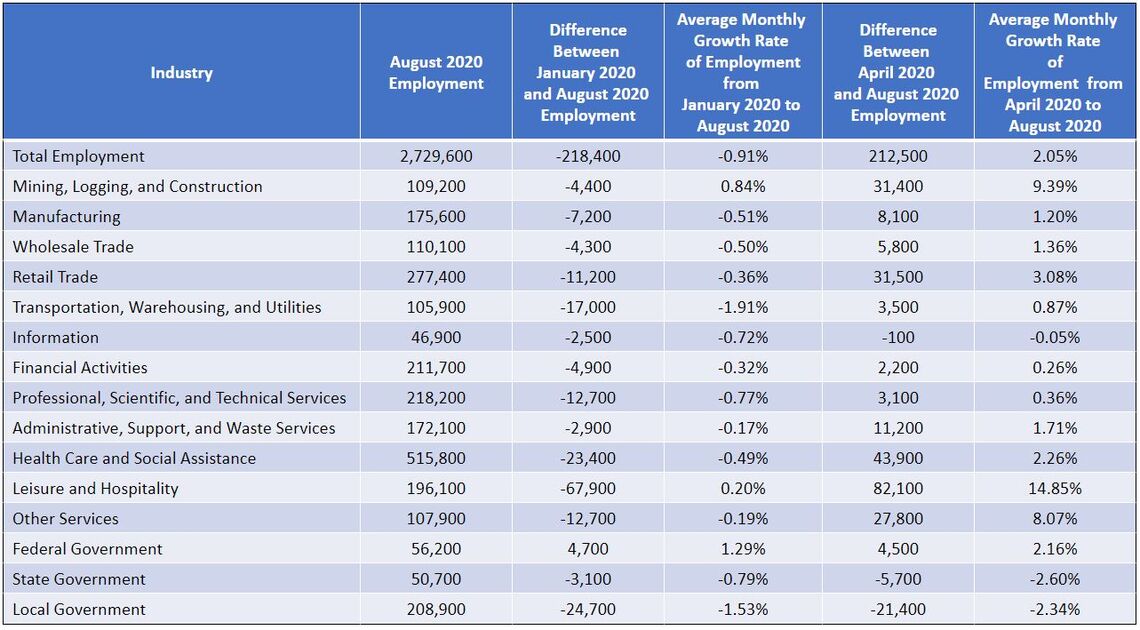
NOTE: Data were obtained from the Bureau of Labor Statistics.

FIGURE 3
NOTE: Data were obtained from the Bureau of Labor Statistics.
A first glance at Figure 2 suggests that the Leisure & Hospitality, Mining, Logging, & Construction, and Other Services sectors experienced the greatest growth during the pandemic, since average monthly growth rates from January to August and April to August far outpace all other industries. Yet this growth reflects the dramatic employment decline in these industries early in the pandemic followed by changes in social gathering restrictions that allowed many to return to work. By April 2020, Leisure & Hospitality employment in Greater Philadelphia was just 43.2 percent of its size in January 2020. This steep employment decline coincided with the initial stay-at-home orders that forced many Leisure & Hospitality businesses—like restaurants, hotels, and entertainment sites and venues—to close and either furlough or lay off workers. The easing of restrictions during the summer months allowed employment in this industry to grow again, Similarly, while many construction workers were required to stay at home during April 2020, a May 2020 reversal of this decision by Governor Wolf allowed employment to bounce back, showing greater growth than the region’s total employment from April to June 2020. As of August 2020, employment levels in Leisure & Hospitality and Other Services still trails the region’s total employment growth.
Only Federal Government employment consistently grew in Greater Philadelphia during the pandemic, posting modest growth from April to July followed by significant growth from July to August. This growth was largely due to the rapid hiring of temporary 2020 Census workers to conduct door-to-door counts [1]. National employment estimates from September and October 2020 show that Federal employment declined significantly as many temporary 2020 Census workers completed their contracts [2]. The public sector often expands in the wake of recession to provide jobs and boost demand. After the 2008-09 recession the Obama administration’s American Recovery and Reinvestment Act pumped billions into infrastructure and energy projects, while the Trump administration’s CARES Act injected stimulus of more than $2 trillion [3].
The industries in Greater Philadelphia that have thus far displayed the greatest rebound are the Other Services, Retail Trade, and Health Care & Social Assistance sectors. Each of these industries saw consistent growth from April to August 2020 surpassing the 2.1 percent average monthly regional growth rate. Employment growth in these industries has been largely driven by the need for essential workers during the pandemic and the reopening of many retail establishments in the summer months. A scan of the change in Philadelphia job posts from April to August 2020 illustrates that the demand for new workers in these two sectors eclipsed many others in the region (see figure 4).
FIGURE 4
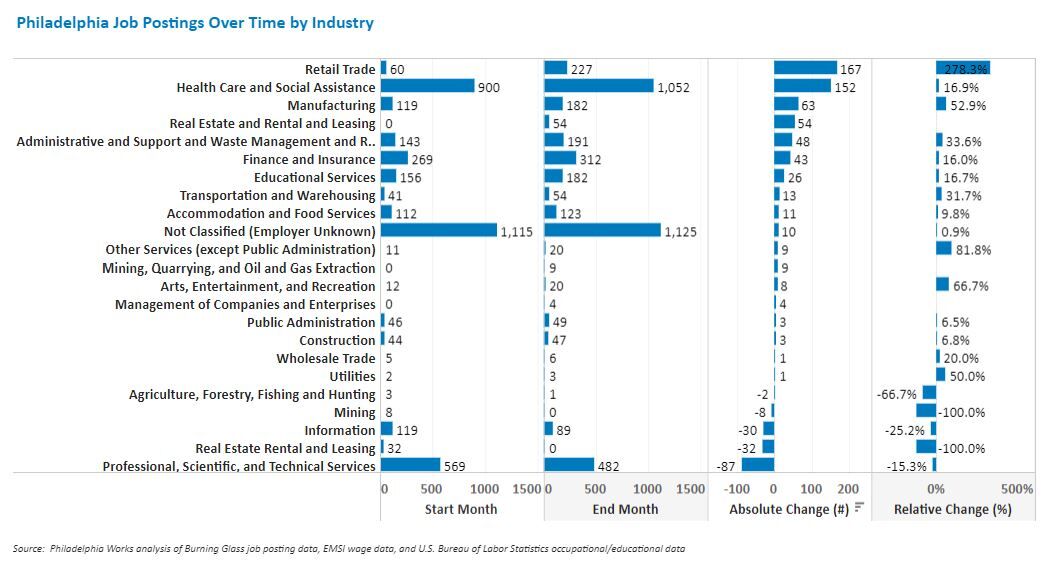
NOTE: Data were obtained from Philadelphia Works.
The Restoration of the Regional Workforce
Even though some regional industries experienced significant rebound and rapid growth in the last few months, the regional unemployment rate is still roughly three percent higher than it was in January 2020. The city’s recent announcement of renewed social gathering restrictions suggests that there may be more rounds of job cuts for many regional sectors in the near future.
We have previously detailed that much of the recent employment growth in the region, prior to the pandemic, was in foundational-skill-level, low-wage jobs. Such jobs provide little security for many low-income workers, who often have to work multiple low-wage jobs just to make ends meet. Building a post-COVID regional economy with sustainable employment opportunities along with healthy churn in the labor market will require concerted business attraction and job creation strategies coupled with workforce policies that upskill workers for higher quality jobs.
Works Cited
[1] Frank, Thomas. 2020. “Here’s where the jobs are — in one chart.” CNBC, 4 September. Retrieved from: (https://www.cnbc.com/2020/09/04/heres-where-the-jobs-are-for-august-2020-in-one-chart.html).
[2] U.S. Bureau of Labor Statistics. 2020. Employment Situation Summary, USDL-20-2033. 6 November. Retrieved from: (https://www.bls.gov/news.release/empsit.nr0.htm).
[3] Dmitrieva, Katia. 2020. “The Times America Went Big and Flooded Economy With Federal Cash.” Bloomberg|Quint, 9 March. Retrieved from: (https://www.bloombergquint.com/global-economics/the-times-america-went-big-and-flooded-economy-with-federal-cash).