Philadelphia's Self-Employed Population
Earlier this month, the Federal Reserve Bank of New York released a data brief detailing the disproportionate impact the pandemic has had on the nation’s Black business owners. We at the Economy League conducted a similar, locally-focused analysis for a story released earlier this week by WHYY. In this Leading Indicator, we dive deeper to demonstrate the pandemic’s impact on local business-owners.
Key Takeaways
- As of 2018, approximately 6.5 percent of Philadelphia’s civilian employed population 16 years or older identified as being self-employed. “Self-employed” may be considered a proxy for business owners.
- The majority of the city’s self-employed are concentrated in the professional, scientific, management, administrative, and waste management industries.
- According to 2012 estimates, roughly 80 percent of the city’s businesses were sole proprietors which are largely owned by Black and Brown residents (95.6% and 93.5% respectively).
- Recent monthly estimates indicate that Black self-employment in the U.S. dropped from March 2020 to April 2020 at three times the rate of white self-employment.
- From March 2020 to April 2020, initial estimates from small samples indicate that Black self-employment in Pennsylvania and Philadelphia dropped 4.4 and 2.1 times the rates of white self-employment, respectively.
The Self-Employed: A Proxy for Business Owners
It is surprisingly difficult to accurately measure the number of business owners living and working within a small geographic area like Philadelphia. Both the natural churn of businesses opening and closing and the complex organizational structure of many establishments make estimations murky at best. A recent analysis by Robert Fairlie of the National Bureau of Economic Research has proposed a proxy measure of business ownership via “self-employment.” Using monthly estimates from the U.S. Census Bureau’s Current Population Survey, Fairlie argues that all who identify “self-employment” as their primary job could be considered business owners. If we accept this premise, then tracking self-employment can shed light on the state of business ownership both prior to and during the COVID-19 pandemic and its economic lockdown.
The Self-Employed Prior to the Pandemic
As of 2018, approximately 6.5 percent of Philadelphia’s civilian employed population 16 years or older identified as being self-employed in either an incorporated or unincorporated business. The distinction being that “incorporated” businesses are a legal distinction that equates a business as a separate financial and taxable entity from its owner(s) while the “unincorporated” business does not separate the owner from financial or tax liability [1]. In Philadelphia, 66.5 percent of the self-employed identified as not being incorporated or unpaid family workers in 2018, while 33.5 percent identified as working in their own incorporated business [2].
Figure 1 compares the self-employed populations of the U.S, Pennsylvania, and Philadelphia from 2008 to 2018. For the past decade, the self-employed population has remained both small and relatively unchanged for all three geographies. Unsurprisingly, the proportion of Philadelphia’s working age population that identifies as self-employed is smaller than those of Pennsylvania and the United States. When compared with more rural sections of the state or country, major cities like Philadelphia have lower rates of self-employment since they offer higher concentrations of employment opportunities. With a host of major employers, those seeking employment in Philadelphia have a wider choice of stable salaried occupations that disincentivizes a need to start a business. Self-employment estimates also include agricultural workers such as farmers who are less likely to live in the city.
FIGURE 1
NOTE: Data were obtained from one-year estimates of the U.S. Census Bureau’s 2008 through 2018 American Community Survey.
Disaggregating by industry shows that the self-employed tend to concentrate in specific sectors. Figure 2 compares the share of self-employed persons by industry in the United States, Pennsylvania, and Philadelphia in 2018. Most self-employed persons are concentrated in the professional, scientific, management, administrative, or waste services followed closely by the construction industry, miscellaneous services, and education, health care, and social assistance services. As previously mentioned, self-employment estimates in the agriculture, forestry, fishing and hunting, and mining sector for the U.S. and Pennsylvania are much higher than Philadelphia.
FIGURE 2
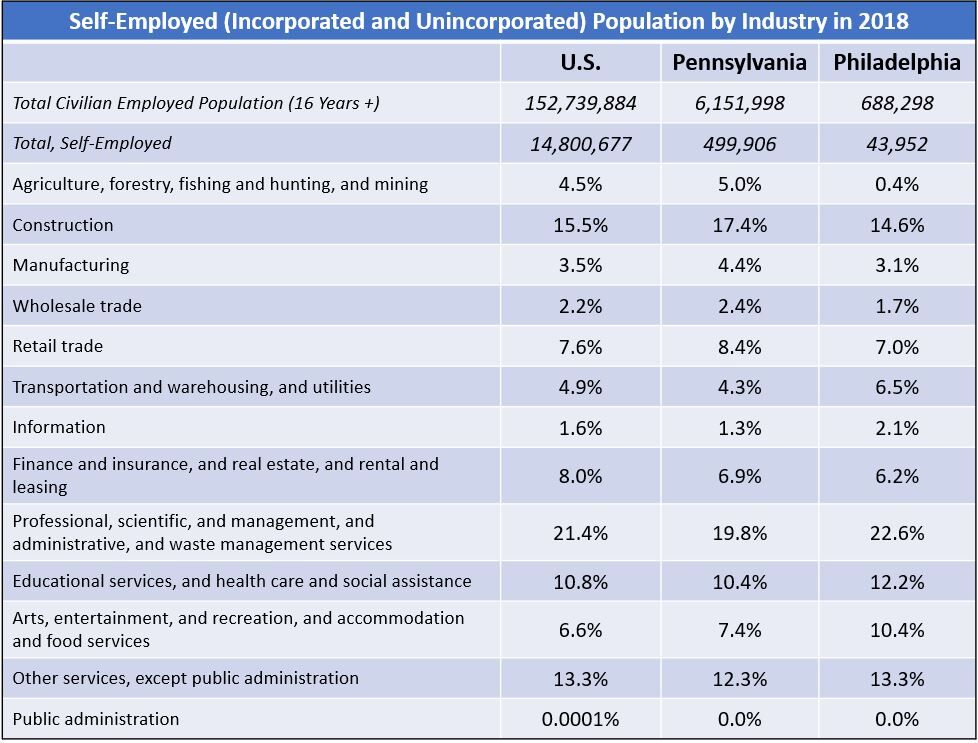
NOTE: Data were obtained from five-year estimates of the U.S. Census Bureau’s 2014-2018 American Community Survey.
Although demographic information on business owners and the self-employed is limited and dated, estimates from the 2012 Survey of Business Owners and Self-Employed Persons (SBO) from the U.S. Census Bureau sheds some light on the distribution of sole proprietors – or businesses without employees. Figure 3 shows that sole proprietors made up roughly 80 percent of the city’s businesses in 2012. These sole proprietorships were also more concentrated among Black and Brown owned businesses (95.6% and 93.5% respectively). Although these estimates reflect Philadelphia’s business community from eight years ago, we still know that small businesses and sole proprietors still dominate the city’s contemporary business landscape. In fact—in a previous Leading Indicator—we found that 53.7 percent of Philadelphia’s businesses employed less than five people in 2017.
FIGURE 3
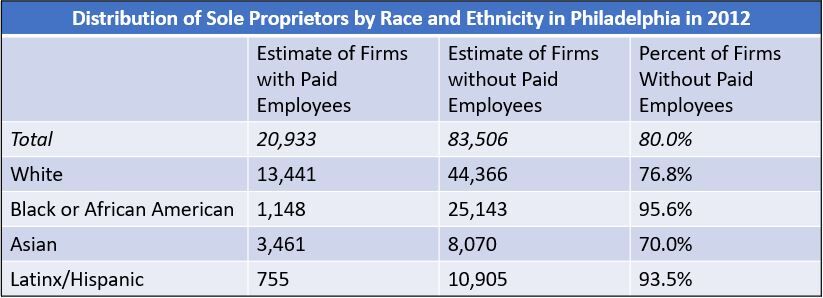
NOTE: Data were obtained from the 2012 Survey of Business Owners and Self-Employed Persons (SBO) from the U.S. Census Bureau.
The Recent Impact of COVID-19 on the Self-Employed
The COVID-19 pandemic’s economic lockdown has had a devastating effect on local businesses. In previous Leading Indicators, we detailed how different industry sectors and racial and ethnic business communities have suffered in the wake of the pandemic. Recent monthly estimates from the U.S. Census Bureau’s Current Population Survey have supported our previous findings. Figure 4 uses monthly estimates to show the dramatic decrease in active self-employment across the U.S. during the initial months of the COVID-19 pandemic.
FIGURE 4
NOTE: Data were obtained from monthly estimates of the Current Population Survey. All “Active” Self-Employed persons include those participating in the labor market, who identified as “currently” employed, and who identified “self-employment” (incorporated and unincorporated) as their primary occupation.
From March 2020 to April 2020, stay-at-home orders took effect in many states and active self-employment in the U.S. decreased by 7.9 percent. However, the shutdown disproportionately impacted white and Black self-employed populations. While white self-employment decreased by 6.9 percent during the same two months, Black self-employment plummeted by 20.6 percent. This was followed by steady growth from May 2020 to July 2020 for all self-employed populations.
Estimates from Pennsylvania and Philadelphia reveal similar trends, though both are subject to higher errors due to smaller sampling. From March 2020 to April 2020, estimates of Black self-employment in Pennsylvania and Philadelphia dropped 4.4 and 2.1 times the rates of white self-employment, respectively.
Self-Employment and Business Growth
Although active self-employment numbers have grown in the past three months, it still stands 497,000 below last year’s estimates nationally. A robust economy is built on the growth of diverse businesses of all sizes. Even larger enterprises that were able to weather the initial lockdown require the goods and services of local smaller businesses to continue to grow. To dig ourselves out of the hole brought on by this pandemic, we will need to actively engage in solutions that build up our workforce and promote financial investment in local business development growth. The data indicate that we may be moving in the right direction, but the Fall may bring with it a virus resurgence that could—once again—push us further down the hole.
Works Cited
[1] BizCounsel. 2019. “DBAs for Unincorporated Businesses.” BizCounsel, June 10. Retrieved from: (https://bizcounsel.com/articles/DBAs-for-Unincorporated-Businesses).
[2] U.S. Census Bureau. 2019. 2014-2018 American Community Survey 5-Year Estimates. Retrieved from: (https://www.census.gov/data.html).