Philadelphia's Student Population, PART 2
With the Philadelphia School District planning to begin the first marking period of Fall 2020 via remote learning, we continue our analysis of Philadelphia’s student population by diving deeper into their economic conditions and the local impact of the digital divide.
Key Takeaways
- Approximately 38.6 percent of Philadelphia’s 6-to-17-year-olds were living in poverty as of 2018.
- In Philadelphia, more than 5 times as many Black children live in poverty as Non-Hispanic White children; nearly two times as many Black children live in poverty as Latinx children.
- As of 2018, 56.6 and 39.2 percent of K-12 students living in poverty in Philadelphia resided in majority-Latinx and majority-Black census tracts, respectively.
- Majority-Black census tracts in Philadelphia have the highest percentage of households with children that have no access to the Internet at 14.1 percent in 2018.
- Majority-Latinx census tracts in Philadelphia are more likely to host households with children without access to a computer (11.6%) and households that use a smartphone as their only computing device (15.9%).
The Impoverished School-Age Population
As of 2018, 38.6 percent of Philadelphia’s 6-to-17-year-olds were living in poverty [1]. Figure 1 shows how this population has been consistently growing since 2008 with an average growth rate of 2.5 percent per year. For the past decade poverty continues to concentrate in Philadelphia’s school-age population even though—as we found in Part 1 of this series—the overall school-age population is declining.
FIGURE 1
NOTE: Data were obtained from one-year estimates of the U.S. Census Bureau’s 2008 through 2018 American Community Surveys. The “school-age” population was measured as all individuals between the ages of 6 and 17 years old. All racial groups (excluding whites) include individuals of Latinx/Hispanic ethnicity.
The research is clear that poverty is a major impediment to academic achievement. Studies have shown that children from lower socioeconomic backgrounds have poorer health and nutrition which affects cognitive and motor skills, limited exposure to early learning and reading tools which academically places them behind classmates from the start, and are exposed to more stressors such as parental job loss or unstable housing which can impact their ability to retain information [2]. Thus, many poorer students start at a lower learning level than their wealthier classmates because of conditions completely out of their control.
Since poverty also falls along lines of race and ethnicity, it exacerbates disadvantages for students of color. Figure 1 shows that Black children have consistently been overrepresented among Philadelphia’s school-age population living in poverty since 2008. By 2018, Black representation among the city’s impoverished school-age population was 1.7 times the representation of Latinx children and 5.5 times that of Non-Hispanic White children. Latinx children comprised the second largest group, and their representation has consistently grown by a rate of 5.7 percent per year since 2008 – the highest average annual growth rate among the city’s major racial or ethnic groups.
Figure 2 shows that the city’s communities of color see the highest concentration of students living in poverty. As of 2018, 56.6 and 39.2 percent of Kindergarten through twelfth graders living in poverty reside in majority-Latinx and majority-Black census tracts, respectively. Among the city’s majority-Non-Hispanic White tracts, only 13.3 percent of enrolled Kindergarten through twelfth graders are living in poverty.
FIGURE 2
NOTE: Data were obtained from five-year estimates of the U.S. Census Bureau’s 2014-2018 American Community All racial groups exclude individuals of Latinx/Hispanic ethnicity. Tracts with a total population of less than 500 residents and/or group quartering exceeding a third of the total population were excluded.
Philadelphia’s Students and the Digital Divide
Poverty also serves to widen the digital divide or the unequal access and use of basic information technology tools like the Internet or computers [3]. The dawn of the Information Age has made the Internet and related technology vital components of economic, business, and workforce development. Exposure to the Internet and computers usually starts at home, but most schools have developed curriculum around the proper use of information technology that sets students on a path to becoming productive members of today’s more-technologically-advanced workforce [4].
Yet many poorer households have difficulty purchasing Internet subscriptions to consistently use computers and smartphones, so many go without [5]. These households end up relying on publicly accessible technology, like computers offered by the Free Library or in schools, when the need arises. While the Internet can be construed as a vital public good, 35 percent of Philadelphia households reported not having any form of an Internet subscription (e.g. broadband, dial-up, or a cellular data plan) in 2018. The vast majority of these households (69.1%) reported making less than $35,000 a year - $8,744 less than the city’s median household income in 2018 [6]. Thus, poverty serves to widen the digital divide.
Figure 3 shows the spatial relationship between poverty, race, ethnicity, and the digital divide among Philadelphia’s student population. Many neighborhoods marked by deep poverty also have limited access to a computer or the Internet. These neighborhoods also tend to be majority-non-white.
FIGURE 3
NOTE: Data were obtained from five-year estimates of the U.S. Census Bureau’s 2014-2018 American Community All racial groups exclude individuals of Latinx/Hispanic ethnicity. Tracts with a total population of less than 500 residents and/or group quartering exceeding a third of the total population were excluded.
Since poverty deepens the digital divide, access to information technology services also falls along lines of race and ethnicity. Figure 4 aggregates the data in Figure 3 by the racial or ethnic majority population of each census tract. Tracts that are majority Black or Brown show the greatest representation of poverty and are the most impacted by the digital divide. More than half of Kindergarten through twelfth grade students living in majority-Latinx tracts are living in poverty – 1.9 times the city’s average. Majority-Black and majority-mixed-race tracts follow with 39.2 percent and 37.2 percent respectively - almost 3 times the representation of majority-Non-Hispanic White tracts. Majority-Black tracts have the highest percentage of households with children that have no access to the Internet (14.1%) which is followed closely by majority-mixed-race and majority-Latinx tracts. Majority-Latinx tracts are also more likely to contain households with children without access to a computer (11.6%) and households that use a smartphone as their only computing device (15.9%).
FIGURE 4
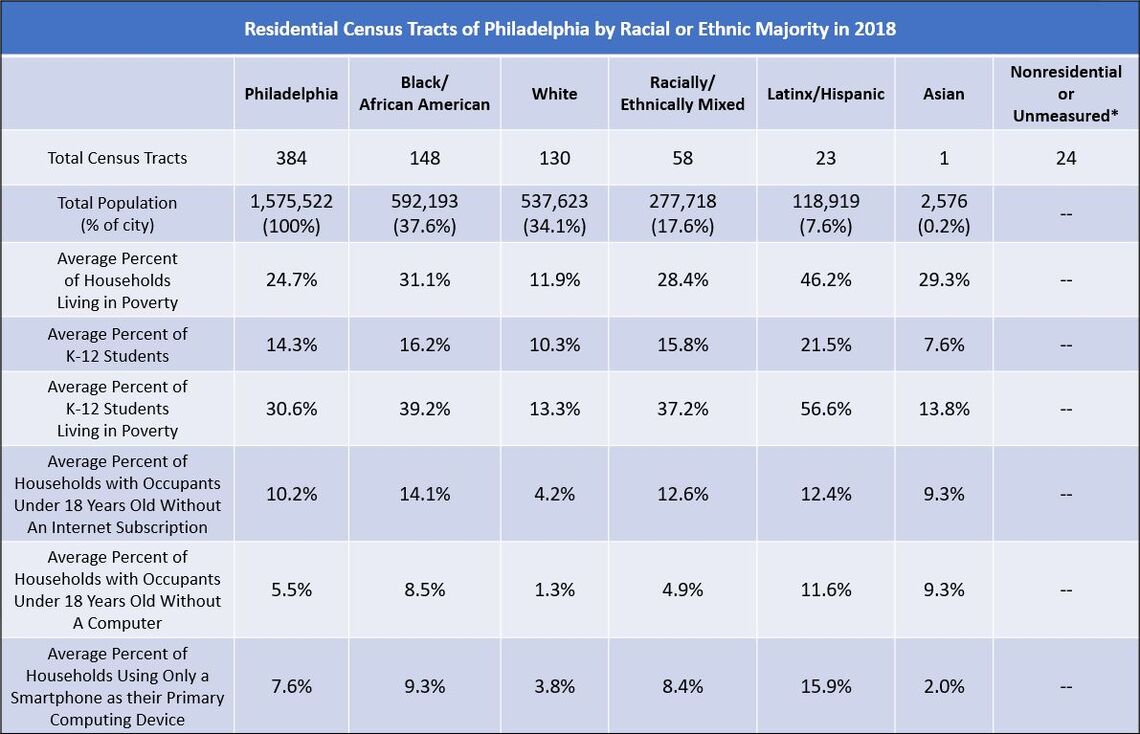
NOTE: Data were obtained from five-year estimates of the 2018 American Community Survey maintained and curated by the U.S. Census Bureau. All racial categories except "Racially/Ethnically Mixed" and "Hispanic/Latinx" exclude persons of Hispanic or Latinx ancestry.
* Unmeasured tracts include any census tract with a population less than 500 residents and any tract where "group quartering" residents exceeded one-third of the total population.
Earlier this month, city officials partnered with Comcast and T-Mobile to provide free Internet access, laptops, and tablets to many Philadelphia students and their families. While this is a step in the right direction, truly closing the digital divide in Philadelphia will require addressing the systemic barriers that prevent workers of color from accessing sustainable, quality employment options. Rectifying local employment options and hiring practices can do more to end the city’s digital divide and provide students with more opportunities to use technology.
Works Cited
[1] U.S. Census Bureau. 2019. 2018 American Community Survey 1-Year Estimates. Retrieved from: (https://www.census.gov/data.html).
[2] Jensen, Eric. 2013. “How Poverty Affects Classroom Engagement.” Faces of Poverty, 70(8): 24-30. Retrieved from: (http://www.ascd.org/publications/educational-leadership/may13/vol70/num08/How-Poverty-Affects-Classroom-Engagement.aspx).
[3] Ramsetty, Anita & Cristin Adams. 2020. “Impact of the Digital Divide in the Age of COVID-19.” Journal of the American Medical Informatics Association, 27(7): 1147–1148. Retrieved from: (https://academic.oup.com/jamia/article/27/7/1147/5826352).
[4] Lee, Nicol Turner. 2020. “Bridging Digital Divides between Schools and Communities.” Brookings, March 2. Retrieved from: (https://www.brookings.edu/research/bridging-digital-divides-between-schools-and-communities/).
[5] Anderson, Monica & Madhumitha Kumar. 2019. “Digital divide persists even as lower-income Americans make gains in tech adoption.” Pew Fact Tank, May 7. Retrieved from: (https://www.pewresearch.org/fact-tank/2019/05/07/digital-divide-persists-even-as-lower-income-americans-make-gains-in-tech-adoption/).
[6] U.S. Census Bureau. 2019. 2014-2018 American Community Survey 5-Year Estimates. Retrieved from: (https://www.census.gov/data.html).