COVID-19: The Real Retail Apocalypse?
With the potential for numerous “nonessential” store re-openings in the coming months, we look at the size and composition of Philadelphia’s retail industry and reveal the impact of the pandemic’s lockdown since mid-March.
Key Takeaways
- As of 2019, retail employment accounts for 7.8 percent of the Philadelphia’s total workforce.
- Philadelphia’s retail industry has been declining since the early 2000s:
- The workforce has contracted annually by 0.4 percent between 2001 and 2019, twice the national rate of decline.
- Average annual wages in Philadelphia’s retail sector declined by 0.4 percent in real dollars between 2001 and 2018.
- While most segments of the retail industry saw employment declines since the early 2000s, Nonstore Retailers, which includes internet retailers like Amazon, and General Merchandise Stores, which includes big-box stores like Target and Walmart, saw employment increase by 4.8 percent and 1.4 percent respectively between 2001 and 2019.
- We estimate that a 30 percent contraction in the city’s retail sector would equate to a direct loss of 14,730 jobs in the city and approximately a $16 million monthly loss in Business Income and Receipt Tax (BIRT) payments.
Philadelphia Retail Prior to the Pandemic
As defined by the U.S. Department of Labor, retail or retail trade includes the final sale of finished goods and services to a consumer [1]. It encompasses a wide variety of firms, from big box chain stores like Target, Walmart and stores in malls, as well as corner stores, bodegas, grocery stores, and internet retail services provided by companies like Amazon. In Philadelphia, there are a plethora of small privately-owned retail establishments as well as chain stores and non-store retailers. In a previous Leading Indicator, we found that 47.7 percent of the Retail and Wholesale Industry in Greater Philadelphia is made up of businesses with less than five employees [2].
Philadelphia’s retail sector workforce was shrinking prior to the COVID-19 pandemic. As of 2019, the city’s retail employment stood at 49,100 or roughly 7.8 percent of the city’s total workforce. Figure 1 compares the size of Philadelphia’s retail sector with the U.S. from 2001 to 2019. Since 2001, Philadelphia’s retail employment has annually declined by approximately 0.4 percent - compared to a national decline of 0.2 percent [3]. For the city, this equates to a loss of roughly 225 retail jobs per year. Some analysts likened this slight annual decline in retail employment to a “retail apocalypse” or the end of brick-and-mortar retail shopping [4].
FIGURE 1
NOTE: Data for this graph were obtained from the Bureau of Labor Statistics’ Current Employment Statistics initiative.
Taking a deeper dive suggests why many analysts believe that brick-and-mortar retail may be on the verge of extinction. Figure 2 compares the distribution of employment in Philadelphia’s retail sector by its subsector industries. Overall job losses in Philadelphia’s retail sector reflect smaller employment losses in Clothing and Clothing Accessories Stores, Sports, Hobby, Music Instrument, Book Stores, Motor Vehicle and Parts Dealers Stores, and Miscellaneous Store Retailers – which include Office Supplies, Stationary, and Gift Stores, Florists, Used Merchandise Stores, and Pet and Pet Supply Stores. Clothing and Clothing Accessories Stores and Sports, Hobby, Music Instrument, Book Stores have seen annual decreases in employment of 3.2 percent and 2.3 percent respectively since 2001.
Meanwhile, Nonstore Retailers, which includes internet retailers like Amazon, and General Merchandise Stores, which includes department stores like Target and Walmart, saw annual increases in employment of 4.8 percent and 1.4 percent respectively during the same period. In sum, many typical brick-and-mortar stores were experiencing steep declines in employment while department stores and internet retailers saw increases, as consumer habits changed to favor more virtual and one-stop-shopping [4].
FIGURE 2
NOTE: Data for this graph were obtained from the Bureau of Labor Statistics’ Quarterly Census of Employment and Wages.
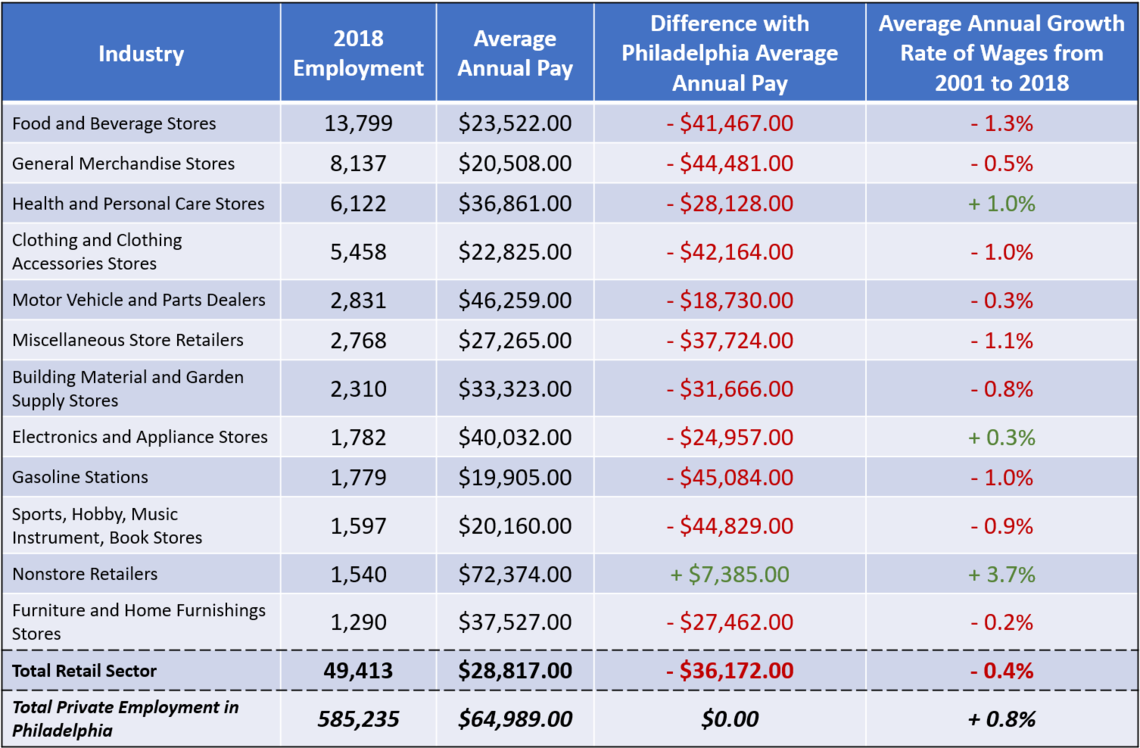
Additionally, wages across all retail subsectors in the city have fallen. Figure 3 displays the average annual wage of each of Philadelphia’s retail subsectors in 2018 and compares them with the city’s average annual wage. It also shows the average annual growth rate of each retail subsector’s wage in real dollars. Only the Nonstore Retailers, Health and Personal Care Stores, and Electronics and Appliance Stores have seen increases in wages since 2001, and only Nonstore Retailers have an average annual wage hirer than the city’s average.
FIGURE 3
NOTE: Data for this graph were obtained from the Bureau of Labor Statistics’ Quarterly Census of Employment and Wages.
Retail’s contribution to Philadelphia’s economy has also declined since the early 2000s. Since 2004, retails sales—as recorded for the city’s Business Income and Receipts Tax (BIRT)—declined annually in real dollars by 1.5 percent [5]. In fact, retail sales in tax year 2018 declined by 4.7 percent from the previous year - from $13.4 billion to $12.8 billion.
COVID-19: The True Retail Apocalypse
With Philadelphia’s retail sector already in decline, the pandemic’s economic lockdown came at the worst time for many stores. Other than those deemed “essential” such as groceries, drug stores, gas stations, and some department stores, most of the city’s retail establishments were forced to close during the stay-at-home lockdown. Since we have yet to come out of the lockdown as of this writing and reliable arms-length tax data won’t be available for some time, we cannot know the precise economic impact of the pandemic on the retail sector, but recent reports indicate significant monthly declines in national retail sales (a 16.4 percent decrease from April 2019), the closure of a myriad of stores, and extensive furloughs and layoffs.
As with our examination of the local food economy, we posit the effects of a 30 percent industry contraction in the city’s retail sector on the city’s economy. From a workforce perspective, a 30 percent contraction would equate to the direct loss of 14,730 jobs in the city. It would also translate to a monthly loss of $16 million in BIRT payments (using April 2019 estimates) [6].
It should be noted, however, that not all retail subsectors were negatively affected by the economic lockdown. A U.S. Department of Commerce report of monthly retail sales in April 2020 showed a 13.4 percent spike in national sales for Food and Beverage Stores and a 13.8 percent increase in Nonstore Retailer sales since 2019 [7]. While large grocery store chains and internet retailers have experienced significant increases in sales, local corner stores and bodegas have seen increases as well. In fact, these small and often family-owned food retailers have become an essential lifeline for many Philadelphia neighborhoods during this crisis. As larger retailers ran out of certain supplies and food products, many sought the services of their neighborhood stores.
Retail in a Post-COVID Economy
The future of Philadelphia’s retail sector will be determined by the behavior of Philadelphia’s consumers and the ability of local firms to adopt new practices. Philadelphia has often been celebrated for its diverse retail offerings. In fact, it is becoming increasingly rare to see a major department store situated next to a locally owned business in many major U.S. cities; yet this is very common in Philadelphia. The pandemic’s impact on this already troubled sector is likely to be deep; major chains stories, like JC Penney and Pier 1 could not survive. Those that navigated this crisis—like the major department store chains and internet retailers—may come out of this pandemic with more capital and resources to expand. With so many small stores devastated, an increasing number of chains may seek to take the place of locally-owned establishments. At the same time, city funding for basic commercial corridor support is on the budgetary chopping block.
At the end of the day, Philadelphia consumers will have a renewed opportunity to shape the city’s retail sector. At the beginning of the crisis, many residents supported their local neighborhood businesses with gift cards, loans, and virtual patronage. With the gradual lifting of restrictions on re-opening in coming months, we will have a better picture of how many local firms have survived. With unemployment projected at its highest levels since the Great Depression, it is also likely that demand will be dampened for some time. At the same time, stores will need to adapt to new and potentially costly ways of doing business in order to make customers feel safe in confined spaces. In sum, there is no doubt this will be a very challenging moment for Philadelphia’s retailers at all levels.
Author’s Note: The author would like to thank Miguel Garces of the City of Philadelphia’s Department of Revenue for his assistance in interpreting publicly available tax reports.
Works Cited
[1] Bureau of Labor Statistics, U.S. Department of Labor. 2020. “Retail Trade: NAICS 44-45.” Industries at a Glance. Retrieved from: (https://www.bls.gov/iag/tgs/iag44-45.htm).
[2] U.S. Census Bureau. 2018. “County Business Patterns by Legal Form of Organization and Employment Size Class for U.S., States, and Selected Geographies.” Economic Annual Surveys. Retrieved from: (https://www.census.gov/data.html).
[3] Bureau of Labor Statistics, U.S. Department of Labor. 2019. Total Employment for Retail Trade for Philadelphia County, PA and the U.S. from 2001 to 2019.” Quarterly Census of Employment and Wages. Retrieved from: (https://www.bls.gov/data/).
[4] Biron, Bethnay. 2019. “The last decade was devastating for the retail industry. Here's how the retail apocalypse played out.” Business Insider, December 23. Retrieved from: (https://www.businessinsider.com/retail-apocalypse-last-decade-timeline-2019-12).
[5] Department of Revenue. 2020. “Summary of Business Privilege Tax (BPT) Revenues”. City of Philadelphia. Retrieved from: (https://www.phila.gov/media/20200326110725/BIRT-analysis-by-sector-report-tax-years-2008-2018.pdf).
[6] Department of Philadelphia. 2020. “Comparative Statement of Net Revenue Collections: General, Grants, Community Dev., Vehicle Rental, and Hotel Funds Report – April 2019” City of Philadelphia. Retrieved from: (https://www.phila.gov/media/20190521162415/City-revenue-collections-report-2019-April.pdf).
[7] Department of Commerce. 2020. “Advance Monthly Sales for Retail and Food Services, April 2020.” Release Number: CB20-69. Retrieved from: (https://www.census.gov/retail/marts/www/marts_current.pdf).