Greater Philadelphia's Declining Transit Ridership
In January, CityLab detailed declines in quarterly transit ridership from 2018 to 2019 in several major U.S. metropolitan areas. Apart from Washington D.C. and New York City, the data—acquired from the National Transit Database—showed most metropolitan areas experiencing a decline in quarterly ridership over a two-year period. Philadelphia seemed to be an outlier in this analysis with the largest percentage decrease in ridership from the second quarter of 2018 to the second quarter of 2019 at 6.5 percent. This decrease, however, only shows a limited view of Greater Philadelphia’s public transit ridership; quarterly changes can often mask seasonal trends. This discrepancy in findings piqued our interest at the Economy League, and we decided to dig deeper into local data sources to see how public transit ridership tracks in Greater Philadelphia over time.
Key Takeaways
- SEPTA’s annual ridership decreased by 3.3 percent between 2018 and 2019;
- Peak annual ridership for the decade occurred in FY2012 with FY2019 reporting the lowest ridership counts of the decade;
- As of FY2019, 88 percent of SEPTA’s total operating revenue came from passenger fares (not including the “Shared Ride Program”);
- Research has demonstrated a strong link between a metropolitan area’s economic vitality and the health of its public transit system;
- More support and organization among regional civic and business leaders who understand the important role public transit plays in the local economy can catalyze advocacy efforts and spur more investments towards ridership
Discrepancies in the Data
Public transit ridership is subject to seasonal trends. Ridership often decreases in the summer months due to vacations and in February where fewer days make for smaller counts [1]. Monthly ridership can also vary from year to year because of localized events like snowstorms, construction or maintenance projects, large events or gatherings, or transit-related accidents. Comparing quarterly changes in ridership often misrepresents these seasonal trends and suppresses the effect of localized events. To account for this, we graphed monthly ridership counts from both the National Transit Database (NTD) and the Southeastern Pennsylvania Transit Authority (SEPTA), Greater Philadelphia’s largest public transportation agency, to see how the national and local ridership data compare (see Figure 1 below).

FIGURE 1:
NOTE: Data for Figure 1 were obtained from the National Transit Database and the Southeastern Pennsylvania Transit Authority and count unlinked passenger trips for all SEPTA transit modes for the calendar years of 2018 and 2019.
Figure 1 shows monthly ridership counts in 2018 and 2019 as recorded by the NTD and SEPTA. Some discrepancies exist between ridership counts recorded by the NTD and SEPTA, but this largely reflects how the data are operationalized and processed by these two organizations. Both utilize unlinked passenger trips or a count of how many passengers board a transportation vehicle [2]. This means a person using one mode of transit from an origin to a destination is counted once, but a person using other modes of transit between their origin and destination are counted more than once (depending on the number of transfers). Local transit agencies, like SEPTA, directly count and estimate ridership on their system through a variety of methods. The NTD requires local agencies to report their ridership data, but then reconfigures the counts into predefined mode categories for comparative purposes. This makes the local data a more accurate measure of direct ridership. Yet even with these discrepancies, the monthly ridership counts from both SEPTA and the NTD show the same finding: SEPTA’s annual ridership has decreased from 2018 to 2019 (by 3.3% according to SEPTA and 4.7% according to the NTD).
Declining Ridership
Two years of data only shows a partial trend. SEPTA has been tracking and reporting on this decrease in ridership for some time. Figure 2 shows total SEPTA ridership counts from fiscal years 2008 to 2009 and breaks down these counts by ridership within the City of Philadelphia, within the surrounding suburban counties, and via the regional commuter rail lines.
FIGURE 2:
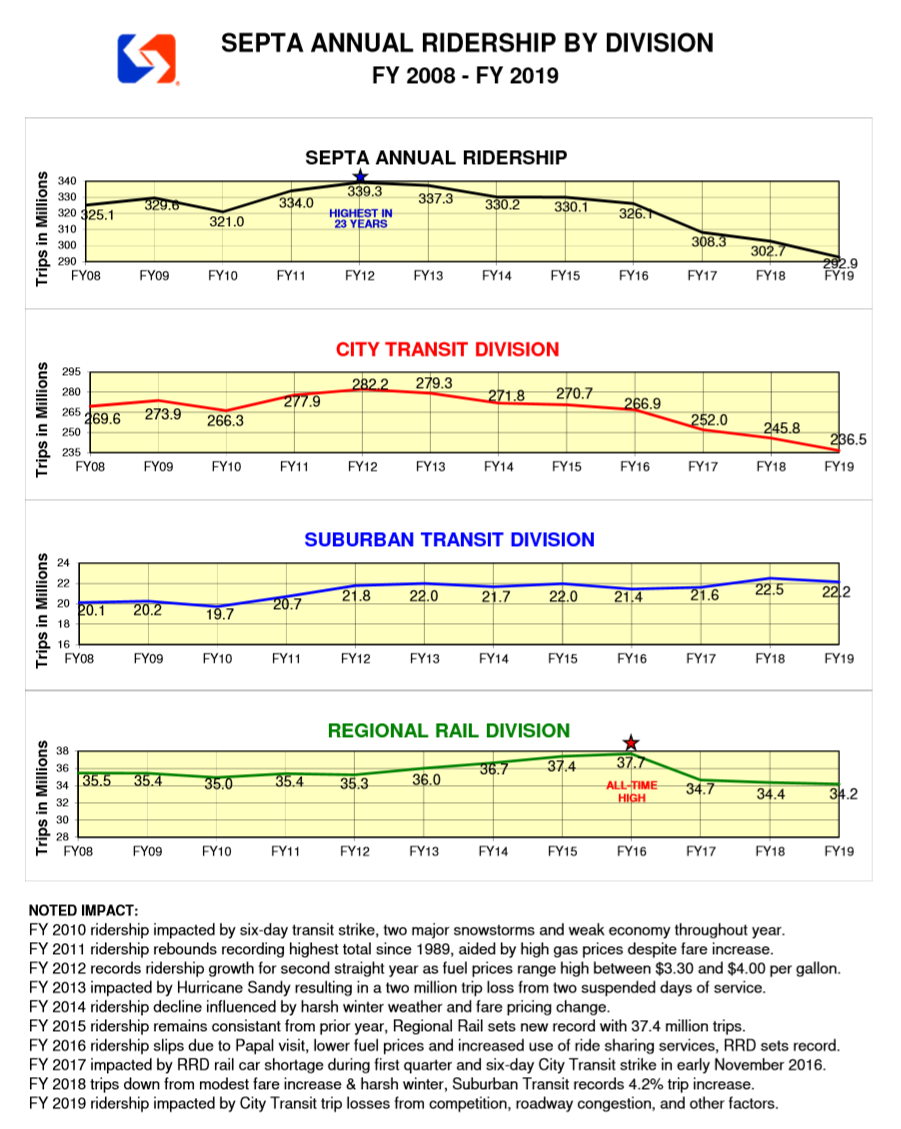
NOTE: Data for Figure 2 were obtained from SEPTA's Revenue Ridership Report: June & Fiscal Year-End 2019.
According to SEPTA, peak annual ridership across all transit modes occurred in fiscal year 2012 but steadily declined since then. In fact, fiscal year 2019 saw the lowest ridership counts of the decade – except in the surrounding suburbs.
Declines in the region’s public transit ridership can stem from a variety of factors. One theory suggests that the relative low cost of fuel and increased concentration of middle-class residents within the city has increased car ownership in Philadelphia. In fact, U.S. Census estimates show that the number of vehicles available to residents in the city has increased by 83,683 (1.8%) from 2010 to 2018 [3]. The rise of ridesharing services like Uber and Lyft has also been blamed for a drop in transit ridership in cities across the country. And more cars on the streets—whether private vehicles or rideshares—promote congestion, which can slow bus and trolley trips and push many would-be public transit riders towards other means of commuting. Many transit and planning experts refer to this as “the vicious cycle” of ridership loss. As ridership counts decline, public transit revenues also decrease, making it difficult for agencies to adapt or improve service to compete with alternative modes of transit; this results in even more passengers deferring public transit use and the cycle continues [4]. This often leaves lower-income communities that rely most on transit with unreliable and inefficient transportation options. And research has demonstrated a relationship between transit reliability and employee turnover, which makes sense—when the duration of a commute is unpredictable, it can affect an employee’s ability to get to work on time or manage getting kids to and from childcare or school.
Public Transit and the Region’s Economy
Employee turnover is a major cost for businesses across sectors, and is just one aspect of local economies that public transit can influence. In many ways, the economic vitality of a metro area is directly tied to the strength of its public transportation system. Continued declines in Greater Philadelphia’s ridership translate to lower revenues for public transportation authorities – which, in turn, equate to limited updates and improvements to the transit system. As of 2019, 88 percent of SEPTA’s total operating revenue came from passenger fares (not including the “Shared Ride Program”). As ridership declines, this revenue stream shrinks, and SEPTA is forced to find ways to supplement the lost revenue by either cutting services or improvement plans or raising fares – a decision SEPTA recently made.
A strong transit system plays a major role in expanding access to economic opportunity in a metropolitan area. A fully integrated multimodal transit system can attract businesses to region, increase employment, pull families out of poverty, decrease pollution, and increase local tax bases [5]. It is no coincidence that leading economic metropolitan regions in the U.S—like New York City, San Francisco, Washington D.C, and Boston—have integrated multimodal transit systems that are constantly working to improve access and update services. To its credit, SEPTA is making a push to update and improve service—particularly on its bus network—and new leadership has promoted a holistic “planner’s” approach to solving issues of equity and accessibility, community engagement, and environmental sustainability. But to succeed, SEPTA will need support from local civic and business leaders who understand the role public transit plays in the region’s economy and advocate for investment in the system.
The Economy League has conducted various analyses uncovering the vital role public transit plays in the region’s economy. We have recommended and supported efforts to form cross-sector leadership coalitions and citizen-led transit advocacy groups that can both educate people about the value of a fully integrated and functioning public transit system and amplify the voices of people, communities, and businesses that rely on transit. With this civic infrastructure in place, a stronger and broader case can be made for public investment in Greater Philadelphia’s transit system at the local, state, and federal levels.
The good news is that progress is on the horizon on this front. We are thrilled to have played a part in the development and launch of Transit Forward Philadelphia—a new coalition working to organize and amplify the voices and ideas of public transit supporters in the Philadelphia area. We recognize the importance of public transportation in Greater Philadelphia’s economy and are optimistic that this new effort will help strengthen the case to expand and improve our system to the benefit of people, communities, and businesses across the region.
Works Cited:
[1] Bureau of Transportation Statistics. 2017. “A Time Series Analysis of Transit Ridership.” United States Department of Transportation. Retrieved from: (https://www.bts.gov/archive/publications/transportation_indicators/march_2002/Special/A_Time_Series_Analysis_of_Transit_Ridership).
[2] American Public Transit Association. N.D. Addendum to the APTA Public Transportation Ridership Report. Retrieved from: (https://www.apta.com/wp-content/uploads/Resources/resources/statistics/Documents/Ridership/APTA-ridership-report-definitions.pdf).
[3] U.S. Census Bureau, American Community Survey. 2010-2018 1-Year Estimates, Table B25046: AGGREGATE NUMBER OF VEHICLES AVAILABLE BY TENURE for Philadelphia County, PA. Retrieved from: (https://data.census.gov/cedsci/).
[4] Bliss, Laura. 2020. “Behind the Gains in U.S. Public Transit Ridership.” CityLab, 13 January. Retrieved from: (https://www.citylab.com/transportation/2020/01/public-transit-ridership-data-bus-subway-metro-train-nyc-dc/604846/).
[5] Weisbrod, Glen; Derek Cutler; & Chandler Duncan. 2014. Economic Impact of Public Transportation Investment, 2014 Update. Washington, DC: American Public Transportation Association. Retrieved from: (https://www.apta.com/wp-content/uploads/Resources/resources/reportsandpublications/Documents/Economic-Impact-Public-Transportation-Investment-APTA.pdf).